John Paulson: Methods and Trade Insights

John Paulson’s best-known investment was his bet against subprime mortgage credit ahead of the financial crisis. The useful lesson is how a researched thesis becomes a position with specific economics, costs, and risks—not simply that going against consensus can pay.
His background also includes merger arbitrage and bankruptcy investing. This article separates that documented history from practical examples you can use in your own research. LuxAlgo’s native charts and Quant, our coding agent, can help you investigate chart behavior and test explicit rules, while company filings and deal documents remain essential for fundamental event analysis.
From event-driven investing to the mortgage trade
Harvard Business School’s profile of Paulson describes his earlier work in risk arbitrage and bankruptcy investing, the launch of Paulson & Co. in 1994, and his mortgage-bond research beginning in 2005. He identified a disconnect between expanding mortgage securitization and deteriorating credit quality.
The mortgage short was not the same as buying distressed bonds cheaply. Credit protection, including credit default swaps, can create exposure that benefits from worsening credit or specified credit events. Its economics depend on the contract, reference obligations, premium payments, valuation, and counterparty performance.
A reported profit, a manager’s personal earnings, a position’s notional amount, and the capital committed are different measures. Avoid combining them into one headline return. Likewise, one extraordinary historical outcome does not establish that a method consistently profits or can be replicated with a retail chart setup.
Video: Paulson explains the trade
In this 2021 interview with David Rubenstein, Paulson discusses the mortgage-market position that brought him to prominence. Treat his retrospective account as a case study, then ask what evidence, financing, and instruments were available before the outcome was known.
Three investment methods worth distinguishing
| Method | Research question | Risk that can invalidate the idea |
|---|---|---|
| Merger arbitrage | Does the spread compensate for the probability and timing of completion? | Deal failure, changed terms, financing problems, or regulatory delays |
| Distressed investing | What can this specific claim recover through restructuring or liquidation? | Weak recoveries, senior claims, dilution, legal costs, and illiquidity |
| Structured-credit analysis | How do underlying losses reach this tranche or derivative? | Model errors, correlated defaults, contract terms, funding, and counterparty failure |
Merger arbitrage: the spread pays for uncertainty
After a cash acquisition is announced, the target may trade below the offer price. That discount reflects uncertainty and the cost of waiting. Read the merger agreement, financing commitments, approval requirements, termination provisions, and expected timetable before interpreting the spread.
For a stock-for-stock transaction, the consideration changes with the acquirer’s share price. A hedge may involve shorting the acquirer according to the exchange ratio, subject to the deal’s actual terms. Equal dollar amounts are not automatically the correct hedge. Borrow availability, fees, dividends, and changed terms also matter.
The T-Mobile–Sprint merger closed on April 1, 2020, following the agreement announced in 2018. It illustrates why an announced deal and a completed deal are different milestones. The transaction’s history alone does not establish Paulson’s entry prices, hedges, or realized returns.
A worked cash-deal example
Suppose a target trades at $48, the cash offer is $50, and your hypothetical deal-break valuation is $40. Ignore costs initially:
| Assumed outcome | Value per share | Gain or loss from $48 |
|---|---|---|
| Deal completes on the stated terms | $50 | +$2 |
| Deal fails and the stock reaches the assumed break value | $40 | −$8 |
At an assumed 90% completion probability, the expected result is 0.90 × $2 − 0.10 × $8 = $1 per share before costs. The breakeven probability in this simplified two-outcome model is 80%. Neither probability is supplied by the spread alone: the deal-break value is itself an estimate, and real outcomes can include revised bids or delays.
The successful-deal gain is $2 ÷ $48, or about 4.17%, over the holding period. It is not automatically an annual return. A longer approval process reduces the annualized result and increases financing or opportunity costs. One $8 loss also offsets four $2 gains before expenses.
Distressed assets: price the claim, not the headline
A security trading far below its former price is not necessarily undervalued. Review the capital structure, collateral, seniority, cash needs, and likely restructuring terms. A business can continue operating while its old common shares lose most or all of their value.
Debt-to-equity ratios and estimated liquidation values can be starting points, but they do not replace claim-level analysis. The amount ultimately available to your security depends on who gets paid first, the recovery process, and the time and expense required.
Contrarian thinking needs evidence that could prove it wrong
Write down what the market appears to expect, what you believe differs, and what development could close that gap. Then identify evidence that would weaken the thesis. Disagreeing with the crowd is not an edge by itself, and waiting longer does not necessarily rescue a flawed valuation.
Separate a fundamental contrarian view from a technical counter-trend entry. An oversold oscillator describes recent price behavior; it does not establish that a company is solvent, that a merger will close, or that a credit instrument is mispriced. Use valuation measures appropriate to the asset rather than attributing a particular ratio or mechanical screen to Paulson without a source.
Check financial periods before drawing conclusions
Thryv provides a useful example of why source dates and accounting definitions matter. Its 2024 Form 10-K reports the following historical results:
| 2024 measure | Reported amount | Research implication |
|---|---|---|
| Total revenue | $824.156 million | Down 10.1% from 2023 |
| Marketing Services revenue | $480.680 million | Different business economics from SaaS |
| SaaS revenue | $343.476 million | Segment growth does not equal growth for the whole company |
| Consolidated net loss | $74.216 million | Revenue and adjusted operating measures are not net profit |
These are dated financial facts, not a current investment recommendation or proof of any manager’s skill. Check subsequent filings before making a present-day assessment. Keep company results, a fund’s holdings, and an investor’s realized performance separate.
A holdings report is an incomplete portfolio snapshot
The SEC’s Form 13F guidance explains that filings generally arrive within 45 days after quarter-end and exclude short equity positions and written options. They do not reveal a manager’s complete economic exposure, original entry rationale, or current holdings.
Healthcare stocks, gold miners, and other sectors may have different business drivers, but sector labels alone do not prove diversification. Gold-mining shares also carry company, operating, and equity-market risks; they are not interchangeable with bullion. Assess common stress scenarios across the whole portfolio.
Size the downside and examine the hedge
In the hypothetical cash deal above, 50 shares cost $2,400 and would lose $400 if the stock moved from $48 to the assumed $40 break value. That scenario loss is not a guaranteed ceiling: a worse outcome could push the price lower.
Set position and portfolio limits using adverse scenarios, liquidity, and correlated exposures. A hedge can reduce one sensitivity while adding premium expense, basis risk, borrow costs, or counterparty risk. Define what it protects against and what remains exposed.
For listed securities, a stop order does not guarantee execution at its trigger price. Event news can produce a price jump beyond the intended exit. A stop-limit order constrains price but may remain unfilled. Conviction should not substitute for a plan for adverse execution.
Build an event-research workspace in LuxAlgo
Use LuxAlgo’s native multi-chart layout to compare the target, acquirer, and a relevant market benchmark. Keep the symbol, timeframe, and session clear. Price charts help examine market response; deal documents establish the terms being evaluated.
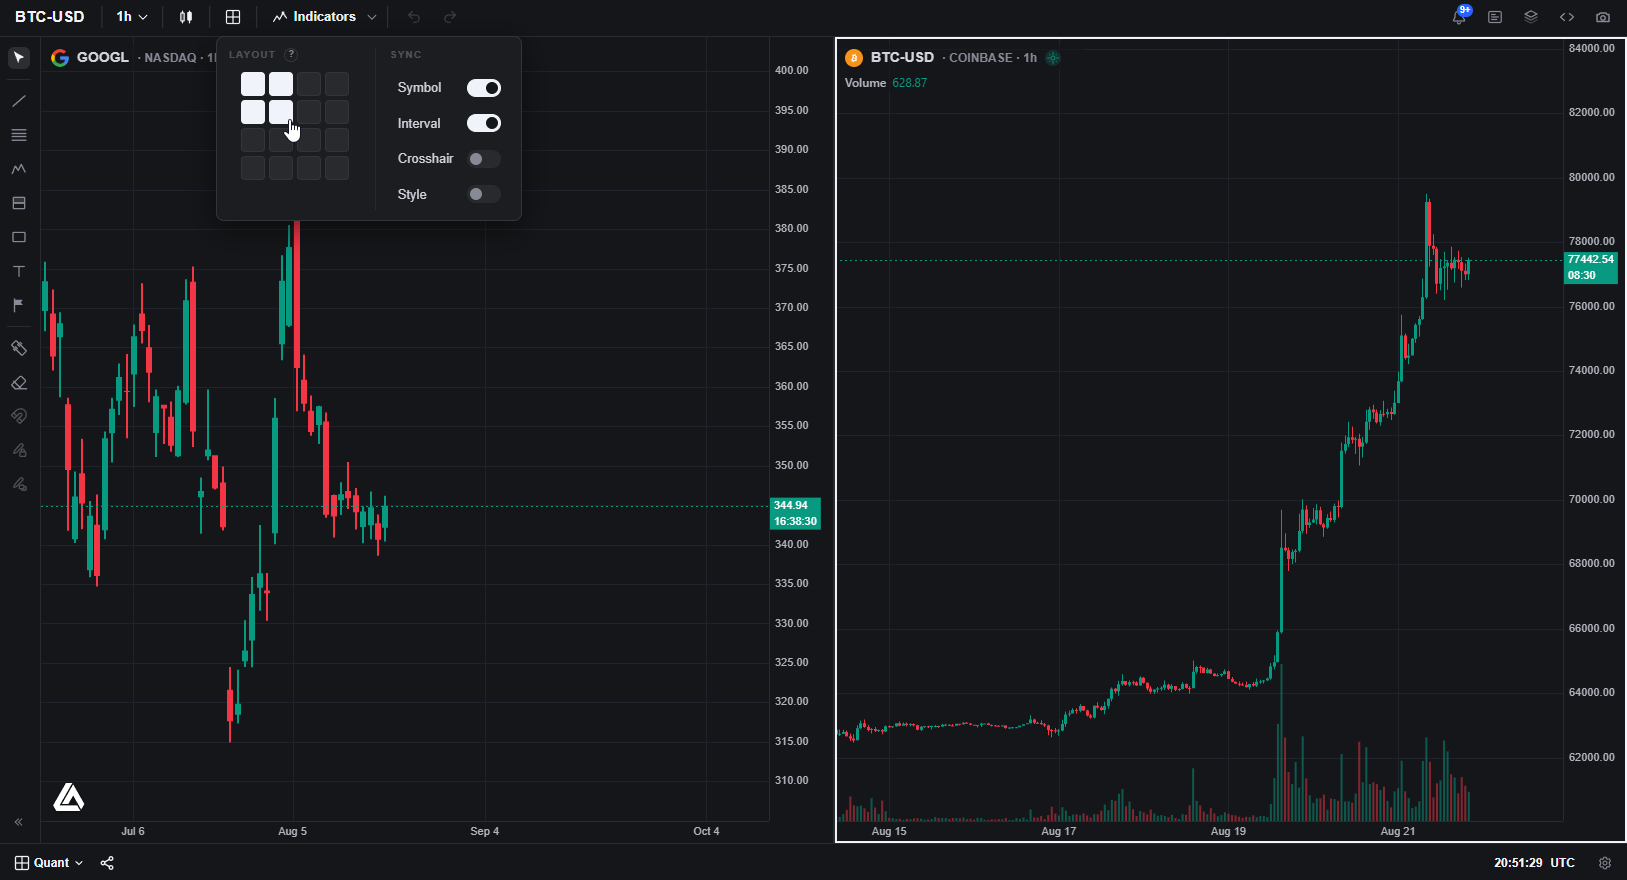
If a technical hypothesis is testable with the available chart data, ask Quant to implement precise entry, exit, sizing, and session rules. Supply verified event dates and timestamps where needed. Do not assume a script automatically retrieves historical announcements or reconstructs what investors knew at each moment.
Review the generated code, backtest properties and trade log, including commission, slippage, and sizing. Keep completed and failed deals in the research sample, avoid using information published after the simulated entry, and test a later period. A profitable test of one surviving company is weak evidence for an event strategy.
Record the thesis, decision, and outcome in the LuxAlgo Journal. This connects research with execution review. Chart analysis and code generation do not, by themselves, place broker orders, enforce protective stops, or establish that a thesis has an edge.
Turn the case study into a repeatable process
Begin with primary documents, specify the economic reason for the opportunity, and calculate both favorable and adverse outcomes. Choose an instrument whose payoff matches the thesis, budget the cost of waiting, and define what would change your mind. Paulson’s mortgage trade is memorable because of its outcome; the transferable work is making assumptions, exposures, and evidence explicit before taking a position.
Read next