Edge Decay: Reoptimize or throw out your strategy.
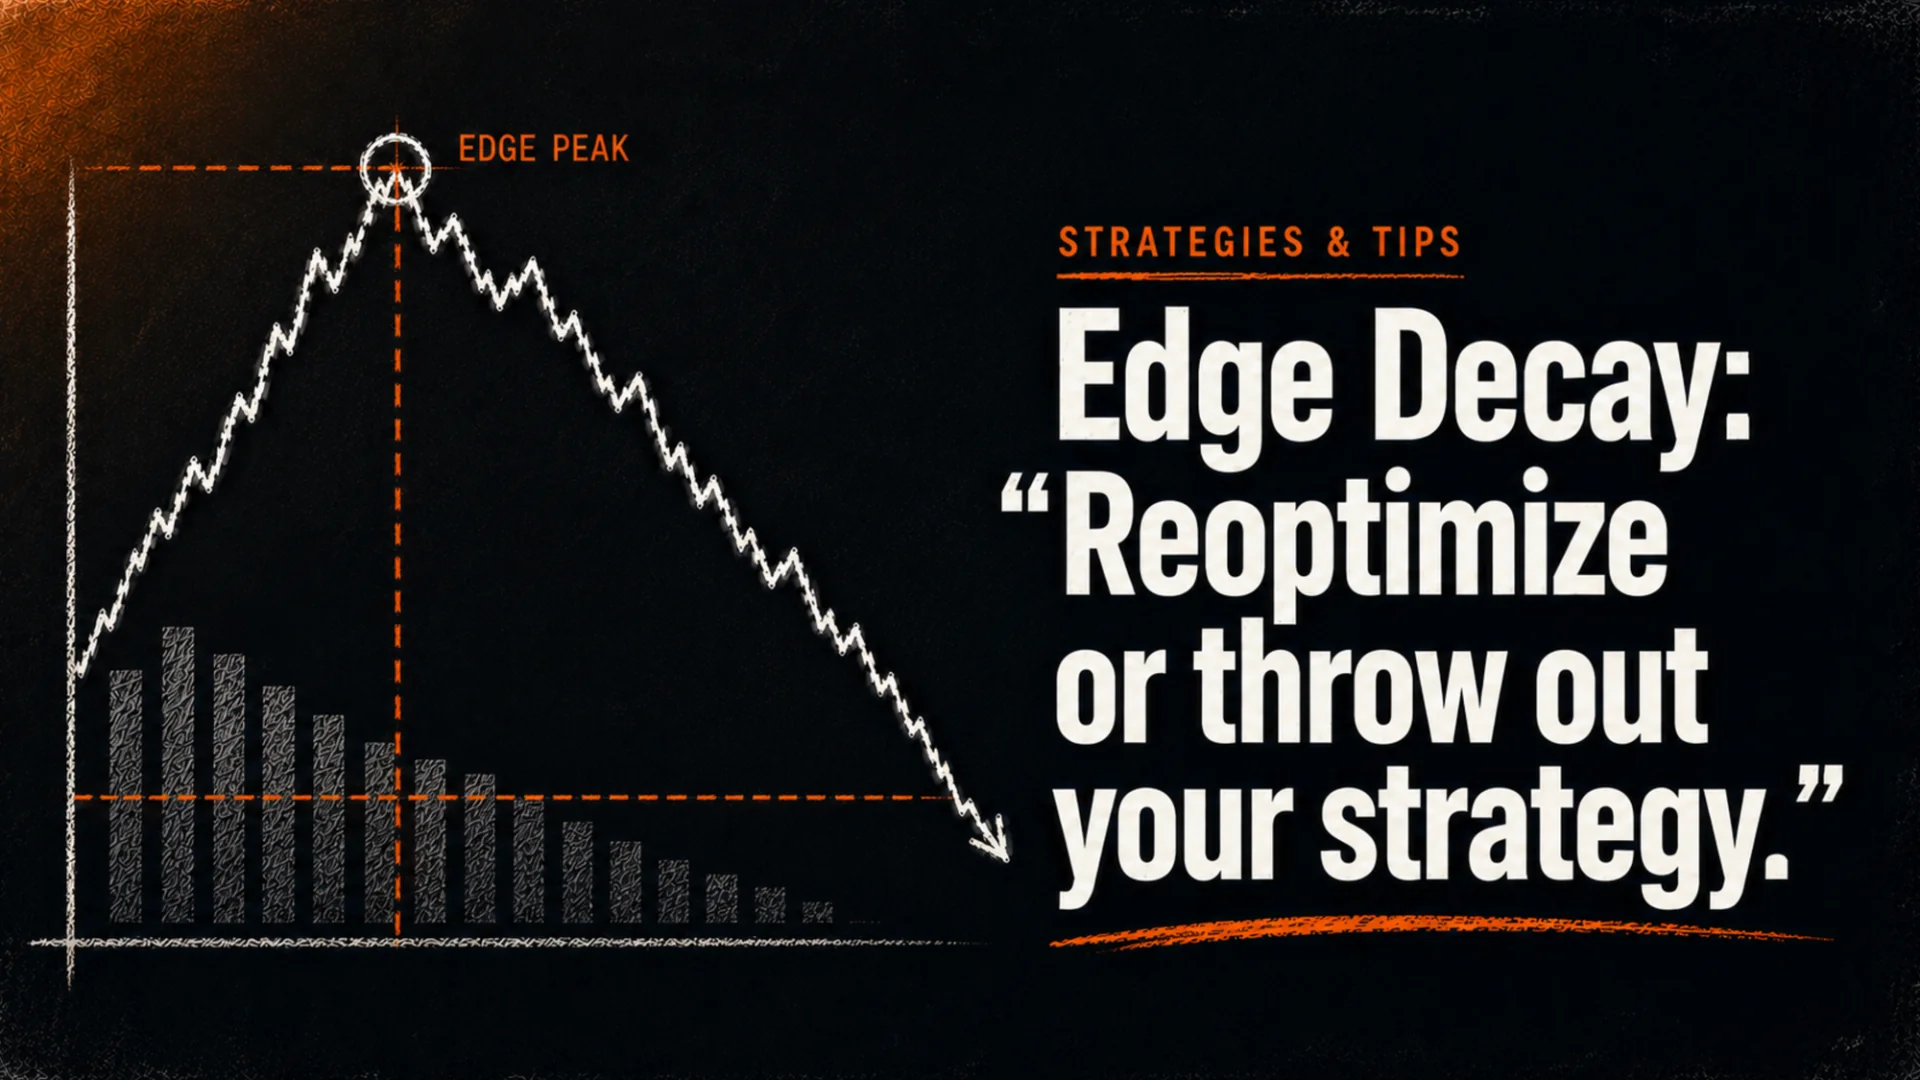
If your strategy’s expectancy is sliding toward $0.00 or below, I would not guess. I would follow predefined rules and a structured stress-testing process. A weak month is not enough on its own. What matters is whether rolling expectancy, drawdown, win rate, profit factor, payoff ratio, and trading costs are deteriorating across multiple independent trade windows.
Here’s the short version:
- I reoptimize only when the core idea still fits the market, out-of-sample results remain positive after costs, and nearby parameter settings produce similar results instead of one isolated optimum.
- I pause or cut size when the evidence is mixed, expectancy is near $0.00, or drawdown is above normal but still within a defensible risk range.
- I retire the strategy when out-of-sample expectancy turns negative, walk-forward tests keep failing, realistic costs erase the edge, or the original market premise no longer holds.
A simple example shows why this matters. Expectancy can be written as (win probability × average win) − (loss probability × average loss). A system with a 60% win rate, $250.00 average win, and $200.00 average loss has an expectancy of $70.00 per trade. If that number falls toward zero, the edge is fading even if the win rate still looks respectable.
What I watch first:
- Rolling trade windows: use at least 30–50 trades for an early diagnostic, then confirm the pattern over 100+ trades when the strategy trades often enough
- Drawdown drift: current drawdown approaching 1.5x to 2x the prior realized maximum, or moving beyond a pre-defined Monte Carlo or bootstrap risk band
- Win rate drops: down 10 to 15 percentage points across back-to-back windows, especially when average win-to-loss performance is also weakening
- Profit factor weakness: sliding from around 1.5–2.0 toward 1.0 after realistic costs
- Cost pressure: slippage, spreads, commissions, market impact, funding, or borrow fees wiping out the gross edge
- Regime mismatch: trend, volatility, liquidity, or range behavior no longer lining up with the setup
These figures are review triggers, not universal shutdown rules. A threshold should be calibrated to the strategy’s trade frequency, payoff distribution, market, leverage, and simulated range of normal outcomes.
If I had to sum up the whole article in one line, it would be this: do not fix a bad strategy with hope; test whether the edge still exists, then reoptimize, pause, or shut it down based on evidence.
Edge Ratio and Edge Decay: Algorithmic Trading Strategy Tips
How to diagnose edge decay with data
Diagnose decay with rolling metrics, regime checks, execution-cost analysis, and performance segmentation before changing the strategy. Start by saving a baseline from the original backtest and forward test, including expectancy, win rate, average win, average loss, profit factor, drawdown, trade frequency, and results by market condition. Without that baseline, it is difficult to distinguish normal variance from a genuine change in the edge.
Track rolling win rate, expectancy, and drawdown
Lifetime averages can hide recent weakness. A strategy that won 55% of trades over a long sample might be winning only 45% in a recent window. That is why rolling and segmented strategy validation matters.
Use both trade-count windows and calendar windows. For active systems, 30–50 trades can provide an early warning, but 100 or more trades usually gives a more stable comparison when enough observations are available. For swing or position systems, 50–100 trades may take too long, so a 3–6 month calendar window can be reviewed alongside the trade-count window. These are practical starting points, not statistical guarantees.
In each window, track win rate, expectancy, profit factor, average R per trade, maximum drawdown, average win, average loss, trade count, and exposure. A falling win rate may be harmless if average winners are growing, while a stable win rate can still hide decay if losses become larger or costs rise.
| Metric | Decay Warning |
|---|---|
| Rolling win rate | Falls 10–15+ percentage points below baseline across two or more consecutive windows and the move is larger than the strategy’s expected sampling variation |
| Expectancy per trade | Multiple windows cluster near $0.00 or turn negative after spreads, commissions, slippage, and other applicable costs |
| Average R per trade | Sustained compression toward 0R; around +0.05R or worse can be a review trigger when the historical baseline was materially higher |
| Current drawdown | Reaches 1.5–2 times the prior realized maximum or exceeds a pre-defined high-percentile drawdown estimate from resampling or Monte Carlo analysis |
If your worst losing streak grows from 8 trades to 12–15, treat it as a warning only after checking how likely that streak was under the strategy’s historical win rate and payoff distribution. Losing streaks naturally cluster, so the relevant question is not whether a new record occurred, but whether the new sequence falls outside the range you planned for.
When several metrics weaken at the same time, do not rush to tweak the system. First, check whether the market regime or execution environment changed.
Check for regime shifts and rising trading costs
Sometimes the strategy is the same. The market is not.
A mean-reversion system built for low-volatility ranges can fall apart in persistent trends. Signals that once led to clean bounces start turning into repeated stop-outs or whipsaws. The logic and parameters may be unchanged, but the market regime the system was designed for may be appearing less often.
Track a few market-condition signals next to your performance metrics:
- VIX or average true range (ATR) for volatility context
- Average Directional Index (ADX) for trend strength
- The share of time price spends trending, ranging, or moving through high-volatility transitions
- Volume, spread, and liquidity conditions around the hours when the strategy normally enters
If the conditions your strategy was built for show up less often, you may be dealing with a structural mismatch rather than a parameter problem. Reoptimizing a range strategy during a trend regime can produce attractive historical settings without repairing the underlying mismatch.
Then reprice the strategy using current spreads, slippage, commissions, market impact, funding, and borrow fees. Trading fees and transaction costs reduce the amount of gross edge that reaches the account, and the effect compounds in high-turnover systems. If expected gross profit per trade is no longer comfortably larger than total expected cost, the strategy may be economically untradable even before its signal logic fully breaks.
Separate signal decay from execution decay by comparing theoretical backtest fills, paper-trading fills, and actual live fills. If the signal remains profitable at mid-price or idealized fills but fails after realistic execution assumptions, the problem is implementation rather than the market thesis.
If costs and regime do not explain the drop, break the track record into comparable segments.
Use segment analysis to spot fading performance over time
Split the track record into quarterly, yearly, or 50–100 trade blocks. Then compare win rate, average R, expectancy, profit factor, and maximum drawdown across those blocks. Use equal trade-count blocks when you want comparable sample sizes, and calendar blocks when you want to see how the strategy behaved through changing market environments.
Do not stop at time segments. Break results apart by long versus short trades, instrument, session, day of week, setup subtype, volatility bucket, trend state, and holding period. A strategy may look weak overall because one side or one market has deteriorated while the rest of the logic remains intact.
One weak block is usually noise. Several weaker blocks in a row, particularly across independent segments, point more strongly toward structural decay. A simple bar chart of average R per trade by segment can make this easy to see. If the bars keep falling from left to right and never recover, the edge is fading instead of merely oscillating around its long-run average.
If these checks point to decay, test robustness before changing parameters.
Test for robustness before reoptimizing anything
Once diagnostics show a real decline, pause before changing the strategy. First, check whether the edge still holds on unseen data and under harsher assumptions. A disciplined algorithmic strategy stress-testing workflow helps determine whether a weak system deserves another round of tuning or should be removed from active trading.
Backtests are hypothetical. The CFTC’s guidance on simulated and hypothetical performance highlights that historical simulations do not represent actual trading and may understate or overstate effects such as liquidity and execution. Treat every backtest as evidence to investigate, not proof of future performance.
Compare in-sample, out-of-sample, and walk-forward results
Every strategy is built or tuned on some set of data. The real test is what happens when it meets data it has not seen before.
In-sample (IS) performance is what the strategy produced on data used to build or tune it. Out-of-sample (OOS) performance is what it produced on a held-out period the optimizer was not fit on. When a strategy looks strong in-sample but weak out-of-sample, that is often a sign of overfitting.
Keep the holdout period genuinely untouched. Once you repeatedly inspect OOS results and alter the strategy in response, that period has effectively become part of the development set. The research on the probability of backtest overfitting explains why selecting the best result from many trials can create false discoveries, even when the final equity curve looks convincing.
Walk-forward analysis repeats the IS/OOS split across rolling chronological periods. It gives you a better view of whether the edge survives repeated re-tuning and different market states. If stitched out-of-sample results remain weak across several walk-forward windows, the edge is not generalizing reliably.
If the edge survives the split but breaks after small input changes, the problem is parameter fragility rather than ordinary market noise. When you need to implement revised logic, LuxAlgo Quant, the coding agent built into every LuxAlgo chart, can generate, validate, and debug Pine Script® indicators and strategies, but the holdout data and validation rules should remain locked while the code is being refined.
Check parameter stability rather than chasing a single best setting
A strategy worth keeping should not depend on one exact setting. It should work across a reasonable range of inputs.
Test the main parameters by making small changes and watching what happens to performance. If the strategy works at one setting and then collapses after minor adjustments, it is probably fragile. Stronger systems tend to show a performance plateau. In plain English, results remain reasonably steady across a zone instead of shooting up at one point and dropping hard on both sides.
Where parameters interact, test them together rather than changing only one input at a time. A two-dimensional heatmap or a three-dimensional surface can reveal whether the chosen values sit inside a broad stable region or on a narrow peak created by historical noise.
| Warning Sign | What It Means |
|---|---|
| Performance spikes at one setting | The optimizer may have selected noise rather than a repeatable signal |
| Minor input changes cause large swings | The system is fragile and more likely to be overfit |
| Nearby settings change the trade logic completely | The strategy may be sitting near an unstable decision boundary |
| Fails across normal market states | The logic may not hold outside the narrow environment used for tuning |
If reoptimization keeps producing isolated “best” results instead of stable performance zones, that is curve fitting, not a sound adjustment. A narrow parameter range is another red flag. At that point, reoptimization is curve fitting in a nicer outfit.
Stress-test with slippage and trade-sequence variation
Before you trust the strategy, run it with higher slippage, wider spreads, realistic commissions, delayed entries, missed trades, and less favorable order fills. For larger positions, include market impact and partial-fill assumptions where the platform supports them.
Then test sequence risk by resampling or shuffling historical trades. A strategy worth keeping should not depend on the exact order in which winners and losers appeared in the original backtest. Use the resulting distribution to estimate plausible drawdowns, losing streaks, and recovery times instead of relying only on the single historical path.
Trade-order shuffling has limits. It can test sequence risk, but it does not recreate changing regimes, autocorrelation, liquidity shocks, or new signal behavior. Pair it with regime-specific tests, parameter sensitivity, and forward testing rather than treating one Monte Carlo result as a complete robustness verdict.
Stress testing helps you see whether the edge survives:
- worse fills and higher costs
- different trade orderings and clustered losses
- volatile, trending, ranging, and low-liquidity conditions
- small parameter changes
- missed signals, delayed execution, and data-quality problems
That way, you are checking the strategy under pressure before additional capital is put on the line.
Decision rules: Reoptimize, pause, or retire
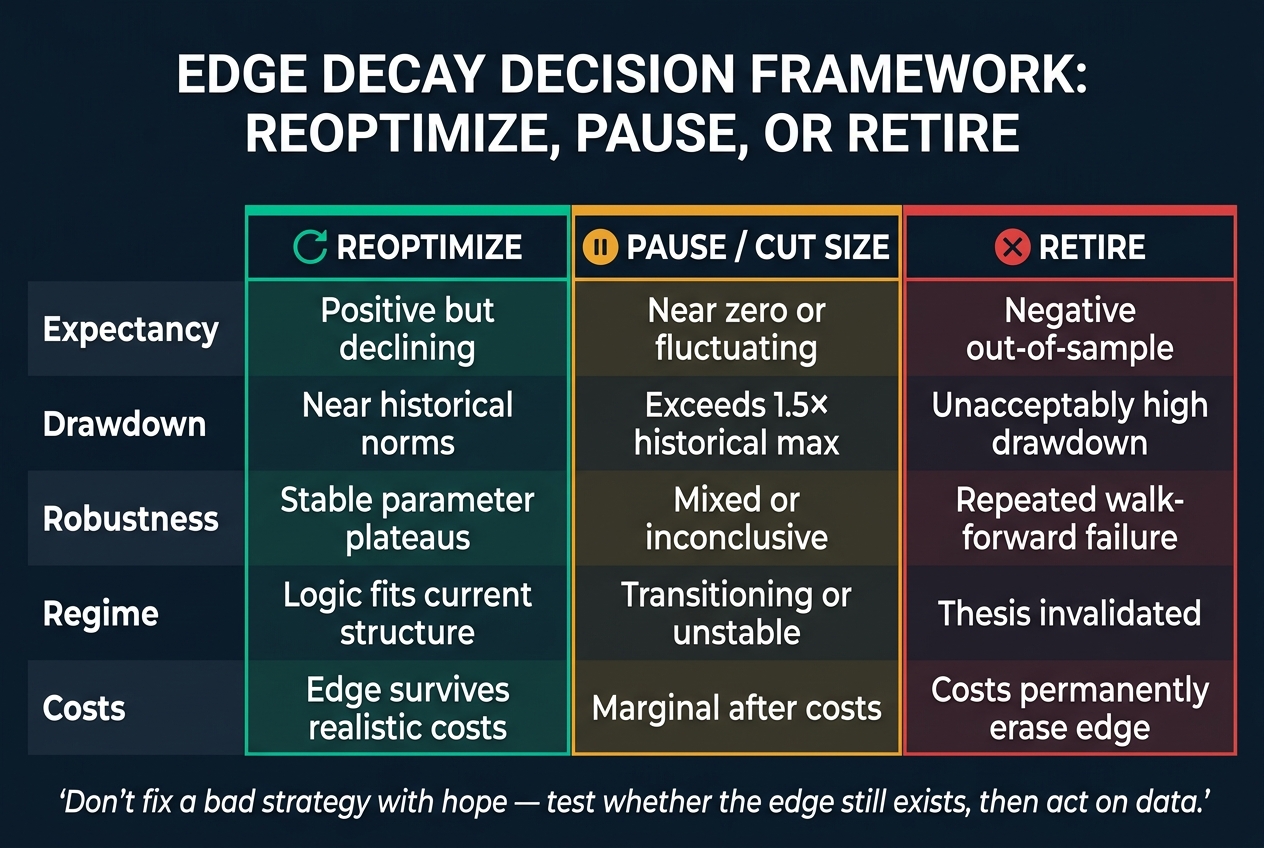
Edge Decay Decision Framework: Reoptimize, Pause, or Retire Your Trading Strategy
When the diagnostics show decay, use a fixed set of rules to decide whether to reoptimize, pause, or retire. The point is simple: once rolling metrics, regime checks, and robustness tests start flashing warning signs, you do not want to make decisions based on stress, hope, or stubbornness.
Reoptimize when the logic still fits the market but performance has slipped
Reoptimize when the strategy’s core thesis still matches the market, but the current settings appear out of sync with present conditions. The goal is to recalibrate the inputs, not rewrite the whole idea, and then confirm the update on data that was not used to select the new settings.
This path makes sense when drawdown remains inside a defensible expected range, out-of-sample expectancy stays positive after costs, and the parameter surface still shows a stable plateau. There should also be enough new data to justify an update. Reoptimizing after every small losing streak gives the optimizer too many chances to fit noise.
Use the same optimization method, parameter bounds, objective metrics, and validation rules each time. After selecting a new region, run it through a fresh out-of-sample or forward period before restoring full-size exposure.
Pause and cut size when the evidence is mixed
Sometimes the data does not give you a clean yes or no. If drawdown is elevated but not catastrophic, expectancy is hovering near zero, or the regime looks unstable, pause full-size trading and reduce exposure while you gather more evidence.
As drift builds, taper size instead of waiting for a hard stop. The reduction should follow a pre-defined risk rule, such as cutting exposure when drawdown crosses a warning band or when rolling expectancy breaches a lower confidence boundary.
Cutting size is not quitting; it is protecting capital while the data catches up. If weakness keeps stacking across independent checks, move to the retirement criteria.
Retire the strategy when the original premise no longer holds
Retire the strategy when out-of-sample expectancy turns negative, walk-forward tests keep failing, parameter stability falls apart, the regime no longer supports the thesis, or current trading costs consistently wipe out the edge.
Write the retirement criteria into your plan before deployment. A preset rule makes it much harder to rationalize a broken edge and keep trading it past its expiration date. Archive the strategy, its versions, and the reason for retirement so any future reactivation begins with a full validation cycle rather than a memory of how well it once performed.
| Criteria | Reoptimize | Pause / Cut Size | Retire |
|---|---|---|---|
| Expectancy | Positive but declining | Near zero or fluctuating around the lower validation band | Persistently negative out-of-sample after costs |
| Drawdown | Near historical and simulated norms | Above the warning band or roughly 1.5x the prior realized maximum | Breaches the hard risk limit or remains outside the expected distribution |
| Robustness | Stable parameter plateaus | Mixed or inconclusive | Repeated walk-forward and sensitivity failure |
| Regime | Logic fits current structure | Transitioning or unstable | Original thesis is structurally invalidated |
| Costs | Edge survives realistic current costs | Marginal after costs | Costs consistently erase the expected edge |
Build a repeatable review process with LuxAlgo
Decision rules only help if you review the strategy on a set schedule and use the same checks every time. That is what turns edge decay from a gut call into a process you can repeat, document, and audit.
Monitor edge health in Quant Charts
Bring the same warning signs from the last section into one review workflow. Use a Quant Charts workspace to review structure and the strategy’s recent trades, the Orderflow suite to study participation, delta, and volume profile behavior around entries, and saved Quant variations to compare the live rule set against alternatives on the same data.
The LuxAlgo Library can provide additional indicators for volatility, trend, structure, and statistical context. Keep the review rules consistent, however. Adding more indicators after every weak period can create a moving target and make it impossible to tell whether the original strategy improved.
Use LuxAlgo Quant to validate changes
To test a candidate rule set, turn it into a strategy and backtest it with Quant against years of history, then inspect metrics such as profit factor, average trade, drawdown, trade count, and long-versus-short behavior. Treat the results as a research starting point rather than final proof.
Use LuxAlgo Quant when the rules themselves need to change. Quant is the coding agent built into every LuxAlgo chart; it writes, validates, debugs, and refines Pine Script® indicators or strategies from plain-language instructions and chart references, and backtests the result in the same window. Its native strategy backtesting workflow also shortens the path from an edited idea to a performance report.
In the native Quant Charts backtest viewer, compare the baseline and candidate using the same symbol, timeframe, date window, starting capital, order size, commission, and slippage. Record the change you asked Quant to make and the number of variations you tried. For a parameter-stability check, change a planned range of values and compare trade count, expectancy, and drawdown; do not keep selecting new values against the final holdout period.
If you export the script to TradingView, verify order timing, commission, slippage, pyramiding, and fill assumptions against the official Pine Script® strategy documentation. Quant reduces coding friction, but it does not replace untouched out-of-sample testing, forward testing, or independent robustness checks.
Conclusion: Keep only strategies with a measurable edge
Keep only strategies that still pass expectancy, robustness, regime, and cost tests. A weak month is not enough to declare an edge dead, but a repeated pattern of negative out-of-sample expectancy, unstable parameters, abnormal drawdown, and worsening execution is too important to dismiss.
The practical workflow is straightforward: diagnose the decline, test the original thesis, validate any revision on untouched data, and apply a pre-written decision rule. Reoptimize only when the edge survives. Pause when evidence is mixed. Retire the strategy when the premise, robustness, or economics no longer hold.
FAQs
How do I tell noise from real edge decay?
Check for consistency across validation layers. A real edge should still show up out of sample, across reasonable parameter changes, and after realistic costs.
Noise tends to fall apart quickly. Performance collapses when inputs move slightly, live results drift far from the backtest, or the result depends on one narrow period, instrument, or trade sequence.
Use walk-forward analysis and parameter sensitivity to distinguish plateau behavior from needle behavior.
- Plateau behavior means results hold up across a range of settings. That is usually a healthier sign.
- Needle behavior means results work only in a narrow pocket of parameter values. That often points to overfitting.
The first 100 live trades can be a useful checkpoint, but 100 is not a universal threshold. Instead of assuming equity must remain within a fixed 15%–20% band of the backtest, compare live cumulative P&L, drawdown, win-loss distribution, and execution costs with prediction intervals derived from out-of-sample data, bootstrapping, or Monte Carlo sequencing. A persistent breach across several measures is stronger evidence of decay than one arbitrary percentage band.
Can a strategy have a good win rate and still be broken?
Yes. A high win rate only tells you how often trades end in profit. It does not tell you whether the strategy makes money overall.
If the average loss is larger than the average gain, expectancy can still be negative. For example, a strategy can win 80% of the time and still lose money if the losing 20% is large enough. That is why win rate should always be read beside average win, average loss, profit factor, expectancy, and drawdown.
A setup can also look better than it is for two common reasons:
- It was overfit to historical data
- It depended on a market regime that has since changed
So when you judge a strategy, do not look at win rate by itself. Put it next to profit factor, expectancy, payoff ratio, and drawdown. Those numbers provide a much better read on whether the edge is still economically useful.
How often should I review a strategy for decay?
There is no one-size-fits-all review schedule. Use both a calendar trigger and a trade-count trigger so slow and fast strategies are evaluated fairly.
An active intraday system might receive a quick weekly health check and a deeper review every 50–100 trades. A lower-frequency swing system might receive a monthly health check and a deeper quarterly review or after 30–50 new trades. The exact cadence should reflect how quickly the strategy generates statistically useful evidence.
Run an additional event-driven review after a meaningful regime shift, a material change in spreads or fees, an execution-platform change, a data-source change, or a drawdown breach. Reviewing does not mean reoptimizing; most reviews should end with no parameter change unless the evidence crosses a pre-defined decision threshold.
References
LuxAlgo Resources
- Stress Testing for Trading Strategies
- How to Validate Trading Strategies Using Data
- Market Regimes Explained: Build Winning Trading Strategies
- How to Use Volatility Indicators for Market Timing
- Directional Movement Index for Measuring Trend Power
- Stress-Test Your Algorithmic Trading Strategy: Guide to Avoiding Overfitting
- LuxAlgo
- LuxAlgo Library
- LuxAlgo Charts
- Quant Charts: Backtest Settings and Results
- Saved Chart Workspaces
- LuxAlgo Orderflow Suite
- Backtesting with Quant
- LuxAlgo Quant
- Quant Documentation
- LuxAlgo Quant: Native Strategy Backtesting Is Here
External Resources
Read next