When Trading Psychology Isn't the Problem
If you follow your rules and still lose money, your mindset may not be the main issue. In many cases, the problem is simpler: the strategy has no edge, costs are too high, risk is off, execution differs from the test, or the market has changed.
Here’s the short version:
- Backtests often look better than live results because historical tests cannot perfectly reproduce unseen data, liquidity, trading costs, or real execution.
- A bad result can come from system flaws, not just fear or greed.
- The main checks are:
- Out-of-sample and walk-forward testing
- Live fills vs. backtest fills
- Slippage, spreads, commissions, and financing costs
- Position sizing and stop placement
- Market regime fit
- Sample size, overfitting, and data quality
- A weak system can look like a discipline problem.
- A working system can look broken if your expectations are off.
I’d look at it in this order:
- Did I follow my rules?
- Does the strategy still show an edge on unseen data?
- Are trading costs killing the setup?
- Is my risk per trade too high?
- Does this market still fit the strategy?
- Am I judging the system by facts or by frustration?
A few numbers can help keep the review grounded, but they should be treated as screening thresholds rather than universal pass-or-fail rules. Some traders look for a profit factor above 1.5 and a maximum drawdown below 20%, but the appropriate targets depend on the instrument, strategy frequency, leverage, and risk tolerance. A 2:1 reward-to-risk ratio is not automatically better if the win rate is too low. If a key live metric deteriorates by 20% to 30% relative to the tested range, I’d investigate it, but I would also check whether that difference is statistically meaningful for the number of trades observed.
I Ran 133,461 Backtests to Find a Real Trading Edge
sbb-itb-cf0ed88
Quick Comparison
| Problem type | What it looks like | What I’d check first |
|---|---|---|
| Behavior problem | Moving stops, skipping trades, revenge trading | Journal, rule-following, process drift |
| System problem | Following rules but still losing | Edge, data, costs, regime fit |
| Risk problem | One loss wipes out many wins | Position size, stop distance, drawdown |
| Execution problem | Backtest looks fine, live trading does not | Slippage, spread, fill quality, latency |
| Expectation problem | Normal drawdown feels like failure | Baseline returns, drawdown history, sample size |
The core point is simple: don’t treat every losing stretch like a psychology issue. Mindset matters when it changes how you execute, but it should not become a catch-all explanation. I’d fix only what the data shows: behavior, system design, risk, execution, or market fit.
A Weak Strategy Can Look Like a Psychology Problem
If you're following your rules and still getting poor results, step back and test the strategy itself. A trader can do everything "right" and still lose money. When that happens, the issue may not be mindset at all. It may be the system.
No Edge, Overfitting, and Small Sample Size
One common problem is a strategy with no durable edge. On a chart, it can look neat and convincing. But a strong historical result alone does not prove much. A system can look good on paper and still fall apart when it reaches unseen data or live execution.
Three flaws tend to cause this:
- Overfitting means the strategy is matching historical noise instead of a repeatable relationship. There is no universal rule that limiting a strategy to two or three parameters makes it safe. Every additional parameter, filter, market, timeframe, and tested variation increases the opportunity to select a lucky result. Research on the probability of backtest overfitting shows why the number of trials matters, not just the complexity of the final strategy.
- Look-ahead and survivorship bias occur when the test uses information or instruments that would not have been available at the time. The CFA Institute’s 2026 backtesting guidance highlights look-ahead bias, survivorship bias, structural breaks, and fat-tailed returns as important limitations to address.
- Small sample size can make a weak setup seem stronger than it is. Twenty or 30 trades is rarely enough to distinguish skill from randomness. The required sample depends on the strategy’s win rate, payoff distribution, trade dependence, and variance, so a fixed number of days or trades should not be treated as proof.
The answer here isn't more discipline. It's better research design, cleaner data, and stronger validation.
How to Check Whether Your Strategy Actually Works
A chronological 70/30 split can be a useful starting point: develop the strategy on the first 70% of the data and evaluate it once on the final 30%. Do not randomly shuffle time-series data, because that can leak future market conditions into the development sample. A stronger process adds rolling or walk-forward tests in which every recalibration uses only information that would have existed at that point.
Some deterioration on unseen data is normal. The question is whether the strategy remains profitable after costs, whether its drawdown stays within a tolerable range, and whether the result depends on one unusually favorable period. A holdout set is also less useful if you repeatedly inspect it and keep changing the strategy, because the holdout gradually becomes part of the optimization process.
A few metrics can give you a quick read on whether the system has promise. A profit factor above 1.5 and a maximum drawdown below 20% are common screening targets, but they are not universal standards. A risk-reward ratio above 2:1 is not automatically desirable either. It must be assessed alongside win rate, costs, and trade frequency. Review net expectancy, average win and loss, tail losses, drawdown duration, turnover, and exposure rather than relying on one headline number. LuxAlgo’s guide to the top backtesting metrics provides a broader framework for comparing profitability and risk.
If live results drift by 20% to 30% from a key backtest metric, treat it as a diagnostic signal rather than automatic proof that the strategy has failed. First check the number of live trades, current regime, execution quality, and whether the observed result still falls within the distribution produced by bootstrap or Monte Carlo analysis.
LuxAlgo Quant, the coding agent built into every LuxAlgo chart, can translate a written specification into Pine Script®, validate the logic, debug implementation errors, backtest the result on the chart, and create controlled variations for comparison. That can reduce coding friction, but the research process should still freeze the test plan before the final out-of-sample review.
If the strategy doesn't pass these checks, move on to the research assumptions before adjusting your psychology. If it does hold up, the next places to look are position sizing, stop placement, and fill quality.
Risk Management and Execution Errors Cause More Damage Than You Think
If a strategy has an edge, the next place to look is risk control and execution.
Position Sizing, Stops, and Drawdown Control
Once you've confirmed the edge, check how risk is being applied, stress test the strategy, and see how orders are getting filled.
The most common risk mistake is simple: risking too much on each trade. If position size isn't tied to account equity, stop distance, and the strategy’s expected drawdown, a single loss can wipe out several winners. And when one loss erases several normal winners, that's not necessarily a mindset issue. It may be a sizing issue.
Stops matter too. If your stop placement comes from habit instead of the actual structure and volatility of the setup, drawdown can run much deeper than the backtest showed. Stops need to fit the setup, while position size should be adjusted to keep the monetary risk within the account’s limits. Moving a stop farther away without reducing size increases risk even if the percentage distance still looks reasonable on the chart.
This gets more dangerous during volatile periods. Financial returns can be skewed, fat-tailed, and affected by structural breaks, which means a small number of stressful sessions can dominate a strategy’s annual drawdown. Volatility can also widen spreads, reduce displayed liquidity, and increase gaps between the intended and actual execution price.
Planned Rules vs. Actual Execution
What the plan says and what happens in live trading often don't match.
Market orders, oversized positions, skipped signals, partial fills, and late entries can all skew performance. Once that happens, your live results are no longer directly comparable with the backtest.
For a strategy with a small average profit per trade, even a few ticks of slippage can absorb most of the expected edge. The CME Liquidity Tool methodology separates bid-ask spread, book depth, and cost to trade because each affects execution differently. The impact also changes with order size, session, volatility, and instrument liquidity.
Skipped setups and manual overrides aren't strategy failures. They're process failures. That's where the review should go: process drift, including skipped trades, late entries, unplanned exits, and manual overrides.
Execution review should include commissions, spread, slippage, partial fills, latency, financing, borrow fees, and rollover costs where applicable. Ignoring these costs does not overstate every strategy by the same percentage. The damage depends on turnover, average trade size, liquidity, and holding period. A more useful calculation is:
Net expectancy per trade = Gross expectancy - commissions - spread cost - expected slippage - financing or borrow costs
If net expectancy is at or below zero under realistic assumptions, the strategy is structurally unprofitable in that environment, no matter how disciplined the trader is.
Low-Quality Data Creates False Confidence
If execution records look clean, the next step is to audit the data behind the backtest. A smooth-looking equity curve built on weak data can create false confidence quickly.
Before you trust a backtest, check a few basics:
- Data completeness: Are there missing candles, duplicate records, stale prices, or gaps caused by feed inconsistencies?
- Timestamps: Are session boundaries, daylight-saving changes, and time zones aligned with the market you're trading?
- Symbol adjustments: Are dividends, splits, delistings, contract rolls, and other corporate or futures adjustments handled correctly?
- Instrument specifications: Are tick size, point value, lot size, margin, and contract multipliers correct?
- Cost assumptions: Are spreads, commissions, slippage, financing, and borrow costs included, and do they reflect the sessions and order sizes being tested?
- Universe construction: Does the historical universe include failed or delisted instruments, or only the symbols that survived until today?
Backtests that leave out slippage and transaction costs can look far better than they should. Tests can also become misleading when they use today’s index constituents, ignore futures roll mechanics, or rely on a cleaner data feed than the trader can access live.
A practical strategy-validation workflow should record the data source, cleaning rules, test window, instrument specifications, and every material assumption. If the data checks out, the next step is to see whether the strategy still fits the current regime.
Market Regime and Unrealistic Expectations Are Often the Real Issue
If the backtests check out and execution looks clean, the next step is simpler than it sounds: ask whether the market still fits the strategy.
Sometimes a strategy keeps losing not because the trader got sloppy, emotional, or undisciplined. It loses because the regime changed.
Trading the Wrong Market Regime
Every strategy has conditions where it tends to work and conditions where it tends to struggle. That’s just how trading works.
A trend-following system generally needs enough directional persistence for its winners to offset false breakouts and whipsaws. A mean-reversion system often performs better when price repeatedly returns toward a reference level and liquidity remains stable. Once volatility expands and price persistently reprices in one direction, the same mean-reversion logic can start accumulating losses.
The transition from 2017 to 2018 provides a useful example. Implied volatility was unusually subdued through much of 2017, which encouraged short-volatility positioning. On February 5, 2018, the VIX moved from 17.31 to 37.32, a one-day increase of approximately 115%, according to Cboe’s review of the volatility shock. Strategies that depended on volatility remaining contained were suddenly operating in a very different environment.
The strategy didn’t suddenly forget how to trade. The conditions supporting it changed. That’s why regime fit can matter more than a psychology story in this kind of situation.
| Strategy Type | Favorable Regime | Unfavorable Regime | What to Watch |
|---|---|---|---|
| Trend-Following | Sustained directional movement with enough range to cover costs | Rangebound chop, repeated false breakouts, or sharp reversals | Trend persistence, breakout follow-through, volatility percentile, and trading costs |
| Mean-Reversion | Two-sided price action, stable liquidity, and repeated returns toward a reference | Persistent one-way repricing, gaps, volatility expansion, or liquidity stress | Speed of reversion, distance from the reference, volatility percentile, and session liquidity |
A practical way to sort this out is to label each trade by realized-volatility percentile, trend strength, session, liquidity, and broader market direction. The implied-realized volatility spread can also be useful for volatility strategies. Avoid using one fixed threshold, such as 8% or 22%, across every market. A volatility level that is extreme for a broad equity index may be normal for a cryptocurrency or individual stock.
If the market is out of sync with what the system needs, standing aside, reducing size, or applying a documented regime filter may be smarter than forcing the original rules into conditions they were never designed to handle.
Unrealistic Expectations Make a Working System Look Broken
There’s another trap here, and it gets a lot of traders: bad expectations.
A strategy can be doing exactly what it was built to do and still feel broken if you expect smooth weekly gains or an equity curve that never takes a hit. That standard sounds nice, but almost no real edge delivers that.
There is no universal annual return range that defines a realistic retail algorithmic strategy. A claim that 20% to 50% is normal for every system ignores leverage, drawdown tolerance, turnover, market capacity, financing, and the instrument being traded. A strategy targeting 15% with limited exposure may be more robust than one showing 80% while carrying hidden tail risk.
If a backtest looks unusually strong, treat it as a reason for more scrutiny rather than proof that the system is exceptional. Check whether the result depends on leverage, a small number of trades, one favorable regime, unrealistic fills, omitted costs, or repeated optimization. Compare returns with drawdown, exposure, tail losses, drawdown duration, and a relevant benchmark.
The better way to judge underperformance is to compare live results against the strategy’s tested distribution, use a sample size that actually means something, and interpret those results in light of the current market regime. A few losing weeks during a choppy stretch don’t automatically mean the system is broken. It may be behaving normally in conditions it was never designed to dominate.
A Step-by-Step Process to Find the Real Cause of Underperformance
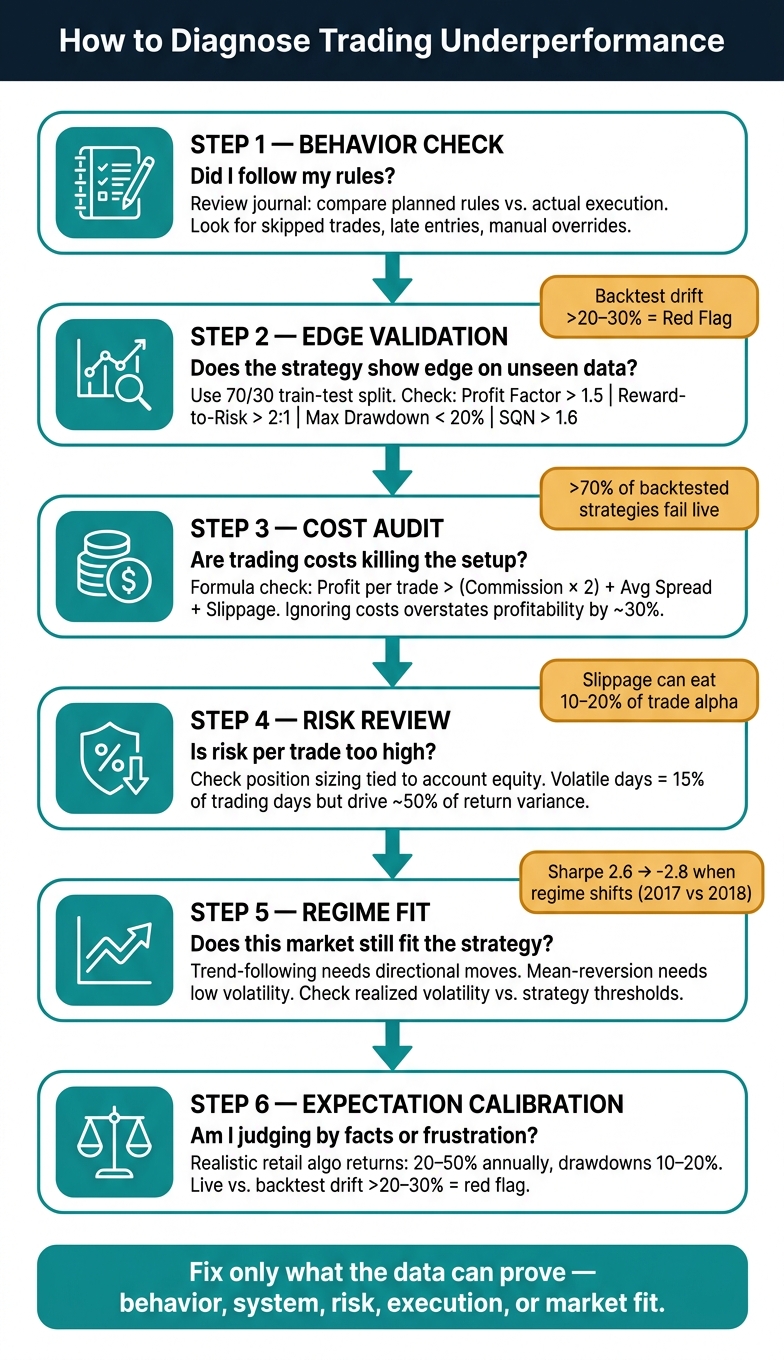
Trading Underperformance Diagnostic: Step-by-Step Root Cause Framework
Use this process to isolate the cause. The goal is simple: find the variable behind the problem before you touch anything.
Journal First, Then Measure the Numbers
Start with your journal. Compare your planned rules with what you actually did in live trades. Then check expectancy, profit factor, win rate, average win and loss, drawdown, and execution quality across a meaningful sample. One hundred trades is a common starting heuristic, but the required number depends on the strategy’s variance and trade distribution.
System Quality Number can be useful as one summary measure, but a single cutoff should not decide whether an edge is durable. An SQN below roughly 1.6 is often treated as weak in common trading heuristics, yet SQN is sensitive to sample size and the distribution of trade results. Read it alongside expectancy, drawdown, profit factor, and confidence intervals rather than treating it as proof.
Here’s what to check:
- Journal review: Match planned rules against actual execution. If you keep drifting from the plan without a rule-based reason, that points to a behavior gap.
- Performance metrics: A profit factor below 1.0 means gross losses exceed gross profits. A profit factor around 1.5 may be a useful screening target, but it does not prove robustness without enough trades and realistic costs.
- Outlier test: Remove the top one or two trades, then remove the best trading day or month. If the system becomes unprofitable, the edge may be concentrated and fragile.
- Segmentation: Split results by setup, direction, session, asset, volatility regime, and trend condition. If performance is strong in one condition and weak in another, you likely have a regime-fit issue.
- Execution gap: Compare the signal price, expected order type, and actual fill. If slippage, spread, or fill probability is worse than the backtest assumptions, that’s an execution-model issue rather than a psychology issue.
- Research log: Record every parameter set, filter, timeframe, and market tested. A strategy selected from thousands of rejected variations needs more skepticism than one derived from a clear hypothesis and a small number of planned tests.
These checks work best when you isolate each setup, market condition, and execution detail on its own. If you lump everything together, the root cause can stay hidden in plain sight.
Using LuxAlgo to Audit Your System
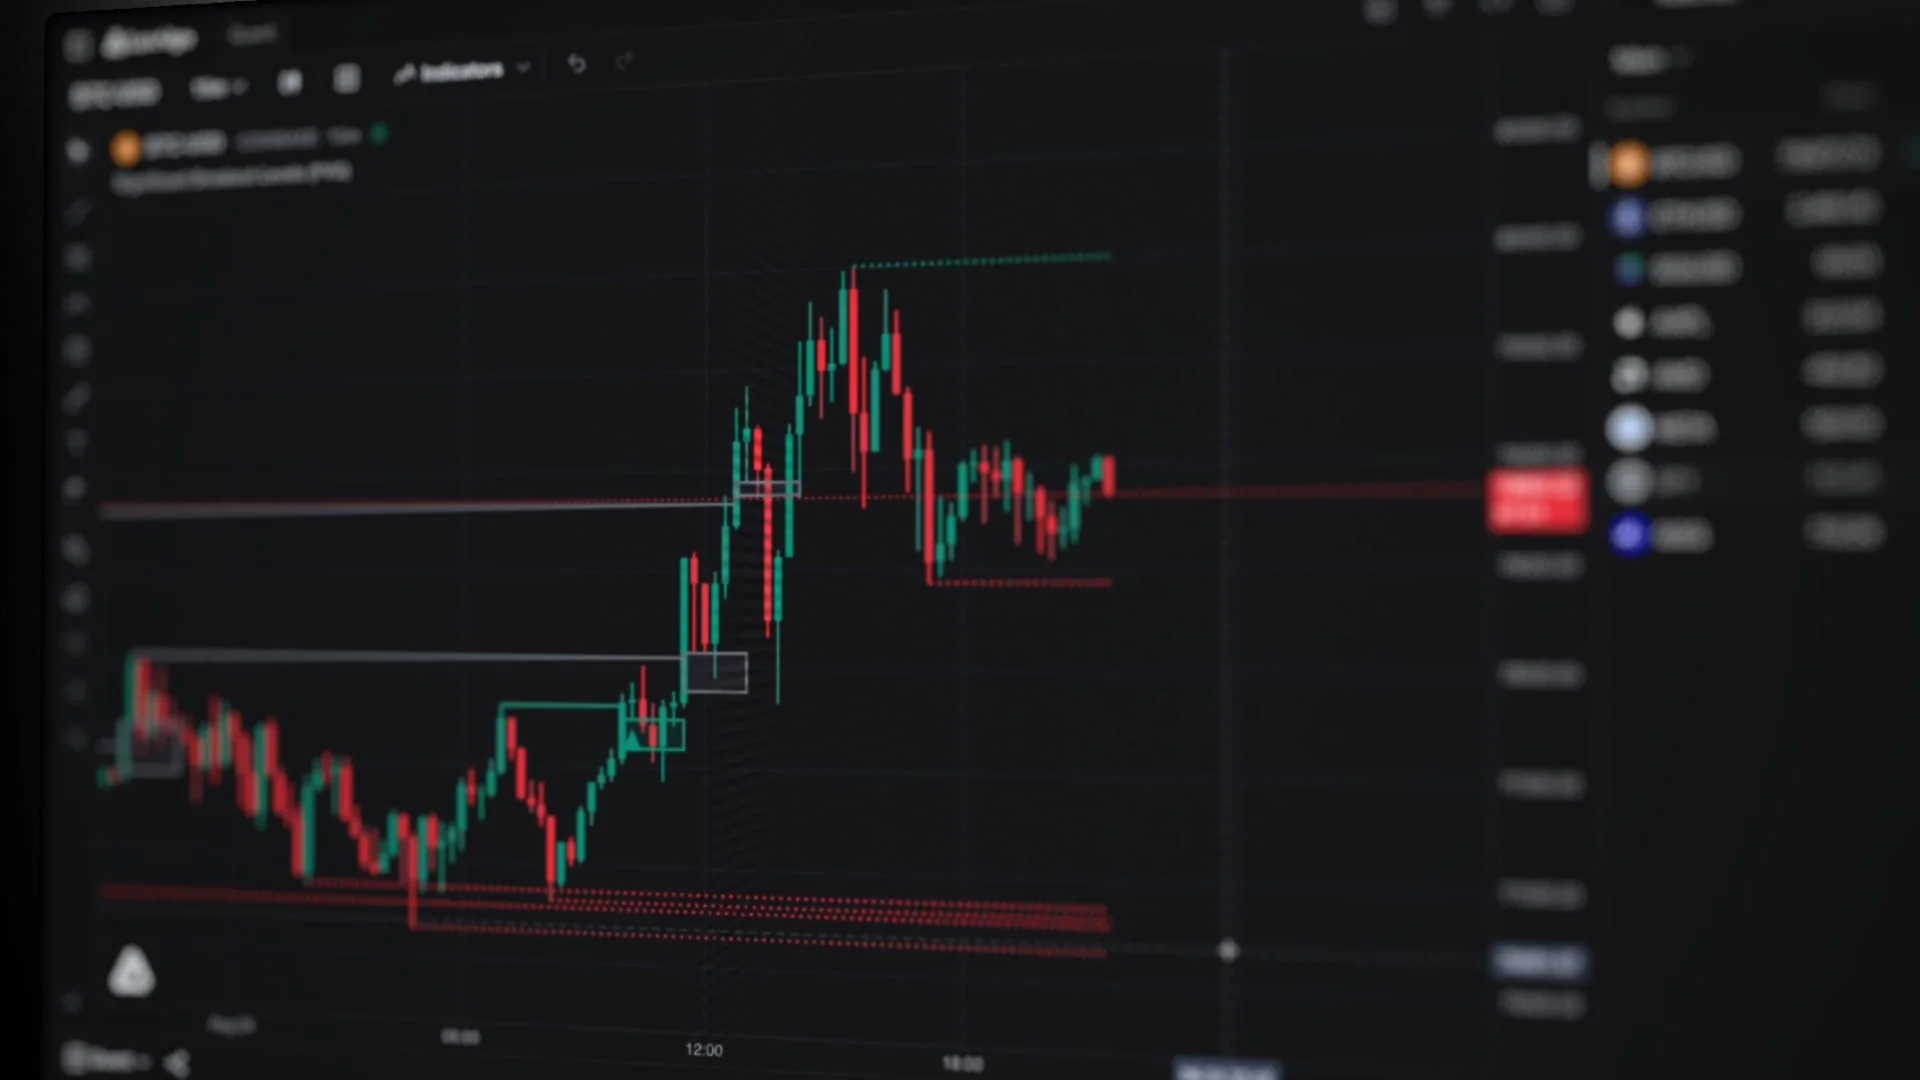
LuxAlgo is an AI trading & charting platform. Its Quant Charts workspace lets you study price action, build a strategy with Quant, and review the historical trades on the chart. LuxAlgo’s native on-chart backtesting in Quant Charts reports net profit, profit factor, win rate, long and short results, and weekday P&L for every strategy Quant builds. Saved variations can help isolate which conditions are contributing to performance across different tickers and timeframes. Starting capital, order size, commission, slippage, margin, and backtesting windows should still be configured to match the intended market and account.
LuxAlgo Quant is the coding agent built into every LuxAlgo chart. It generates and validates Pine Script® indicators and strategies from plain-language rules, existing code, or chart screenshots, then helps debug the implementation and backtests controlled variations in the same window; scripts export to TradingView in one click. The Quant documentation covers these workflows, while TradingView’s Pine Script® v6 User Manual remains the primary language reference.
Compare the test with recorded trades
Use the Journal beside Quant Charts for the other half of the audit: what happened in your account. It records fills and derives round-trip trades, with fees, net P&L, and duration. Matching entries and exits can appear on the active symbol’s chart, making it easier to review the market context around an actual trade.
- Keep the planned rules: save the strategy specification and cost assumptions you tested with Quant.
- Record the execution: add or import fills, then note late entries, skipped signals, or unplanned exits. A journal cannot infer a skipped trade from fills alone.
- Separate the causes: use Breakdown to group recorded results by setup tag, symbol, side, entry hour, or holding time. Read each slice alongside its trade count.
- Review a comparable period: the Compare view compares accounts or the selected range with the preceding period. It does not automatically reconcile a strategy backtest against broker fills.
For example, a losing breakout setup with repeated late-entry notes calls for an execution review. Losses that persist in a frozen out-of-sample test after realistic costs call for a strategy review. Keep simulated results and recorded trades labeled separately so one does not stand in for the other.
These products can shorten the path from an idea to a testable strategy, but they do not remove model risk. The trader still needs to define the hypothesis, preserve unseen data, count the number of trials, model realistic execution, and decide what evidence would invalidate the strategy.
Conclusion: Fix the Cause You Can Prove
Use the evidence before you change the system. Let the journal show behavior gaps, let out-of-sample results test the edge, let segmentation expose regime sensitivity, and let execution logs reveal slippage. Fix only what the data can prove.
Psychology matters when it causes you to break a valid process. It cannot create an edge that is not there, compensate for unrealistic costs, or make a regime-dependent strategy work in every market. Separating those problems is how you avoid trying to solve a system failure with more discipline.
FAQs
How do I know if my strategy has a real edge?
Treat your strategy like a hypothesis, not proof that you’ve “figured it out.”
A real edge should remain positive in chronological out-of-sample and walk-forward testing. It should also stay reasonably stable when you make small, sensible parameter changes instead of falling apart the moment one setting moves.
The numbers must work after trading costs. That means commissions, spread, slippage, financing, and any relevant borrow or rollover costs need to be part of the test.
You also want the strategy to survive Monte Carlo or bootstrap analysis and avoid depending on one trade, month, asset, or market regime. If performance collapses outside the data it was tuned on, the strategy may be overfit, regime-dependent, or based on an edge that is too small to survive implementation.
When should I blame execution instead of the system?
Blame execution when the trading signals remain valid but live results drift from the test because of slippage, commissions, spread, latency, partial fills, or poor order placement. A strategy can look solid on paper and still fail once realistic market frictions are introduced.
Use forward-performance logs to compare the intended signal price, order type, size, and exit with what you actually received. If the live execution gap is larger than the strategy’s expected profit per trade, the strategy is not viable under those execution conditions, even if its underlying signal still has predictive value.
How many trades do I need before judging results?
There’s no one-size-fits-all number. 30 to 50 trades can provide an early signal, 100 or more may offer a steadier first assessment, and 200 to 500 trades across multiple conditions can support stronger validation. None of those numbers guarantees statistical confidence.
The required sample depends on the win rate, payoff ratio, variance, tail losses, trade frequency, and dependence between trades. You want enough round-trip trades to reduce randomness, narrow the confidence interval around expectancy, and cover the market regimes in which the strategy is expected to operate.
References
LuxAlgo Resources
- Backtest Everything
- Quant Charts: Native Backtest Viewer
- Platform Journal Overview
- Journal Breakdown
- Journal Compare
- Risk-Reward Ratio vs. Win Rate: Key Differences
- Top 7 Metrics for Backtesting Results
- Stress Testing for Trading Strategies
- How to Validate Trading Strategies Using Data
- LuxAlgo Quant
- LuxAlgo Quant Introduction
External Resources
- Bailey et al.: The Probability of Backtest Overfitting
- CFA Institute: Backtesting and Simulation
- CME Group: Understanding the CME Liquidity Tool Methodology
- Cboe: After the Volpocalypse - VIX Moves on February 5, 2018
- TradingView: Welcome to Pine Script® v6
- I Ran 133,461 Backtests to Find a Real Trading Edge
Read next