
Understand the Judas Candlestick pattern to identify false reversals and trend continuations, enhancing your trading strategy with key insights.
The Judas Candlestick is a unique trading pattern that helps traders identify false reversals and trend continuations. Named for its "betrayal" of initial moves, it often appears during high-volatility periods like the London (3:00–5:00 AM GMT) or New York session openings (12:00–5:00 AM NY time). Here's what you need to know:
- Structure: A large bearish (red) candle followed by a bullish (white) candle with a long lower shadow matching the red candle's length.
- Purpose: Spot institutional trading, confirm trends, and improve risk management.
- When It Occurs: Typically during major market session openings, highlighting potential liquidity manipulation.
Why It Matters
- Helps traders avoid false signals and refine entry/exit points.
- Combines well with indicators like RSI, moving averages, and volume analysis for better accuracy.
- Works best in trending markets but requires caution in range-bound or low-liquidity conditions.
By understanding this pattern, you can improve your trading strategy and gain insight into market behavior.
How to Spot Judas Candlesticks
Main Features of Judas Candlesticks
The Judas Candlestick pattern stands out with specific visual markers on trading charts. It consists of a large red bearish candle indicating strong downward momentum, followed by a bullish candle with a smaller body and a lower tail that aligns with the previous bearish candle.
This pattern often appears during periods of high volatility, especially at the start of major trading sessions. These times are frequently associated with liquidity manipulation.
Step-by-Step Pattern Recognition
- Identify the Original Trend: Spot a strong directional market move that shows clear momentum.
- Observe a sharp reversal: In an uptrend, this will look like a large bearish candle moving against the trend.
- Confirm the "Betrayal": Look for the bullish reversal candle that counters the bearish move, featuring a long lower shadow.
Comparing Similar Patterns
While the Judas Candlestick shares some traits with other reversal patterns, its unique features make it distinct. For example, although it might look like a standard pinbar reversal, its defining characteristic is the specific relationship between the two candles' sizes and the timing of its occurrence.
| Feature | Judas Candlestick | Standard Pinbar | Engulfing Pattern |
|---|---|---|---|
| Structure | Large bearish candle followed by a bullish candle with a matching lower shadow | Single candle with long shadow | Two opposing candles where the second engulfs the first |
| Timing | Common at session opens | Can appear at any time | Can appear at any time |
| Shadow Length | Lower shadow roughly matches the previous candle's length | Variable shadow length | No specific shadow requirement |
| Market Context | Found at key turning points | Can appear in any trend | Often found at trend endings |
To identify this pattern effectively, pay attention to key support and resistance levels, especially in sideways markets where order blocks and liquidity pools often create high-probability setups. Combining this pattern with volume analysis can help confirm institutional activity, making it a powerful addition to your trading setups.
Related Video
Trading with Judas Candlesticks
Trading with the Judas Candlestick pattern requires careful attention to timing, risk management, and the use of supporting indicators.
When to Enter and Exit Trades
The Judas Candlestick often signals trend continuation and is most commonly seen during the London and New York market opens. Always wait for the full pattern to form before entering a trade to confirm momentum shifts.
| Trading Component | Bullish Setup | Bearish Setup |
|---|---|---|
| Entry Trigger | Upward reversal confirmed after a counter-trend move | Downward reversal confirmed after a counter-trend move |
| Stop Loss Placement | 10–20 pips below the Judas swing low | 10–20 pips above the Judas swing high |
| Best Trading Sessions | London/New York Opens | London/New York Opens |
Managing Trade Risks
Given the volatile nature of the Judas Candlestick, tight stop losses are essential. Place your stop 10–20 pips away from the swing points, and adjust your position size to stay within your risk tolerance.
"Each candlestick is a simple, yet powerful tool to understand what's happening in the market." – Steve Nison
- Stop Loss Placement: Ensure your stop loss is below the low for bullish setups or above the high for bearish setups.
- Position Sizing: Adjust your trade size based on your risk parameters.
- Market Timing: Execute trades during high-liquidity periods, such as major market sessions.
Adding Other Technical Indicators
To improve the reliability of the Judas Candlestick pattern, combine it with key technical indicators. This approach helps validate trade signals and increases confidence.
- Momentum Oscillators: Tools like the Relative Strength Index (RSI) can confirm potential reversals.
- Moving Averages: Use these to assess the trend's direction and strength.
- Volume Analysis: Higher trading volume often signals institutional involvement, which can support the pattern's reliability.
Pattern Performance in Markets
The Judas Candlestick shows varying success depending on market conditions and asset types, often standing out during specific trading sessions.
Pattern Results by Market Type
| Market Condition | Pattern Effectiveness | Best Trading Time |
|---|---|---|
| Trending Market | Reliable for trend continuation | London/NY Opens |
| Range-bound Market | Moderate – requires focus on key levels | During high liquidity |
| High Volatility | Strong – highlights clear price shifts | 3:00–5:00 AM GMT |
In Forex markets, institutional order flow often enhances the pattern's reliability. For instance, on the EUR/JPY 1-hour chart, the Judas swing is frequently observed during the London session.
Professional Trading Insights
"The Judas swing term was named by ICT, he dubbed this swing concept and utilizes it upon the London Open. The idea is, the market maker will rally or sell price, normally just above or below the Asian session high or low (depending on institutional order flow bias) tricking buyers or sellers into the market to follow its direction. As the Judas swing high or low is formed, price is quickly reversed either taking out stops and or leaving traders out of the game."
"The ICT Judas Swing is named after the biblical character Judas, known for his betrayal. In the context of trading, the Judas Swing leads traders into a false sense of security before turning against them, much like the biblical Judas led Jesus to his arrest."
Common Trading Mistakes
- Timing Errors: Trading outside the optimal window (midnight to 5:00 AM New York time) reduces the pattern's reliability.
- Pattern Validation: Neglecting to confirm the pattern using higher timeframe analysis can result in false signals. The 1-hour and 4-hour charts tend to filter out market noise, making them more dependable.
Advanced Pattern Analysis
Pattern Use by Trading Style
The Judas Candlestick pattern can be applied across different trading styles, but each requires a specific approach. Day traders often find success using this pattern during high-liquidity times, such as major session openings. Swing traders might prefer waiting for confirmation of broader trends and using wider support and resistance levels. Meanwhile, scalpers focus on quick entries, targeting false breakouts with tight stop-losses.
| Trading Style | Optimal Timeframe | Key Implementation Points |
|---|---|---|
| Day Trading | 1H – 4H | Focus on session openings; confirm with market structure |
| Swing Trading | 4H – Daily | Wait for trend confirmation; rely on broader support/resistance |
| Scalping | 15min – 1H | Act fast on false breakouts; use tight stops |
Market Condition Adjustments
Your approach should align with current market conditions for better results.
In trending markets, the pattern works best when the main trend is clearly visible. Traders should identify the overall trend direction and wait for a counter-trend move before positioning for a continuation.
In range-bound markets, success depends on:
- Pinpointing key support and resistance zones
- Locating order blocks near range boundaries
- Setting profit targets that fit within the range
Pattern Limitations
Recognizing the limitations of the Judas Candlestick pattern is crucial for managing expectations. Common challenges include:
- Interpretation can vary among traders
- Current fundamentals are not reflected in historical data
- Low-liquidity periods often lead to false signals
- Effectiveness decreases as the pattern gains popularity
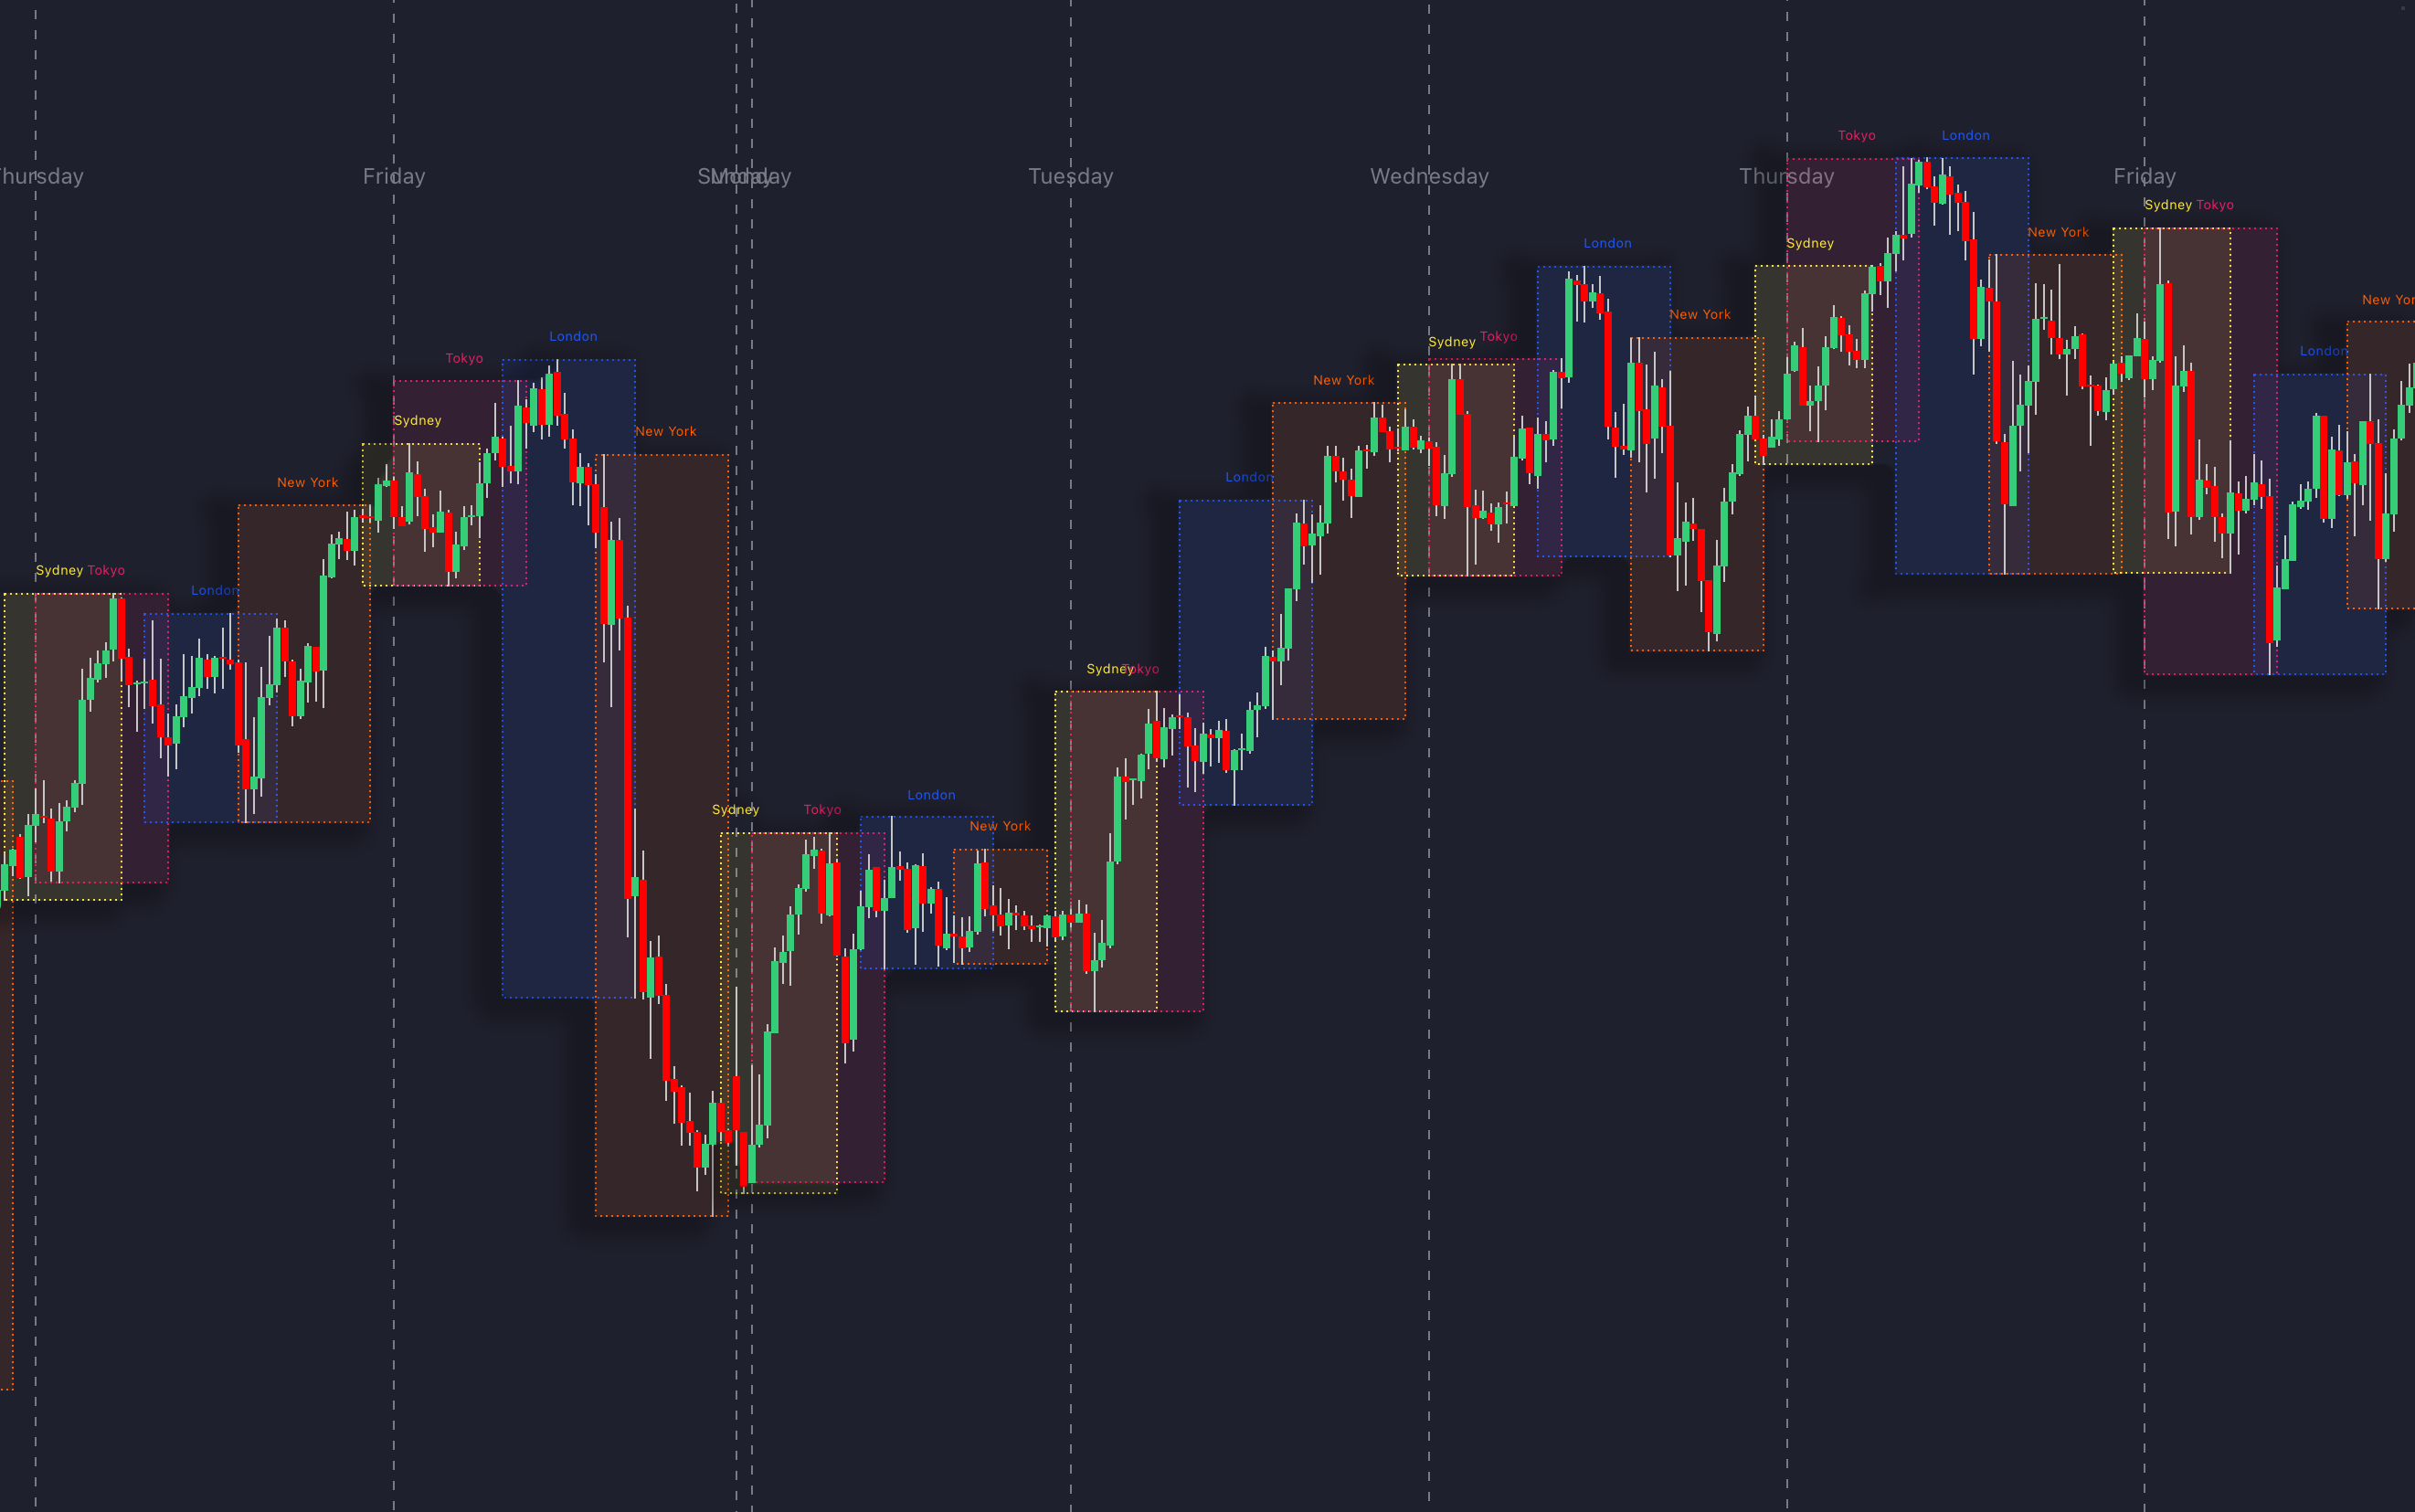
Identifying Optimal Session Times with the Sessions Indicator
Use the Sessions indicator to visually highlight major trading sessions on your chart, making it easy to pinpoint when the Judas Candlestick setups are most likely to form. The Sessions indicator shades the London, New York, and other regional trading windows directly on your chart so you can see liquidity spikes and session overlaps at a glance.
Key usage tips:
- London Session (3:00–5:00 AM GMT): Watch for strong institutional swings at the session open.
- New York Session (12:00–5:00 AM NY time): Look for continuation signals as U.S. markets ramp up.
- Session Overlaps: Periods when London and New York overlap can produce the most pronounced Judas swings.
Conclusion
Key Insights on the Judas Candlestick Pattern
The Judas Candlestick pattern helps traders spot trend continuations by highlighting false reversals at critical market points.
Here’s how understanding this pattern can improve your trading:
| Advantage | How It Helps |
|---|---|
| Trend Validation | Confirms the strength of the current trend |
| Avoiding False Reversals | Reduces the chance of exiting profitable trades too early |
| Clear Risk Management | Offers defined points for setting stop-loss orders |
Steps to Apply the Pattern
- Spot the Pattern: Look for a strong trend followed by a sharp reversal.
- Set Up the Trade: Enter the market only after the price quickly reverts to the original trend.
- Manage Risk: Use stop-loss orders strategically—place them below bullish lows or above bearish highs to safeguard your position.


