Breaker Blocks vs Order Blocks: Key Differences Explained
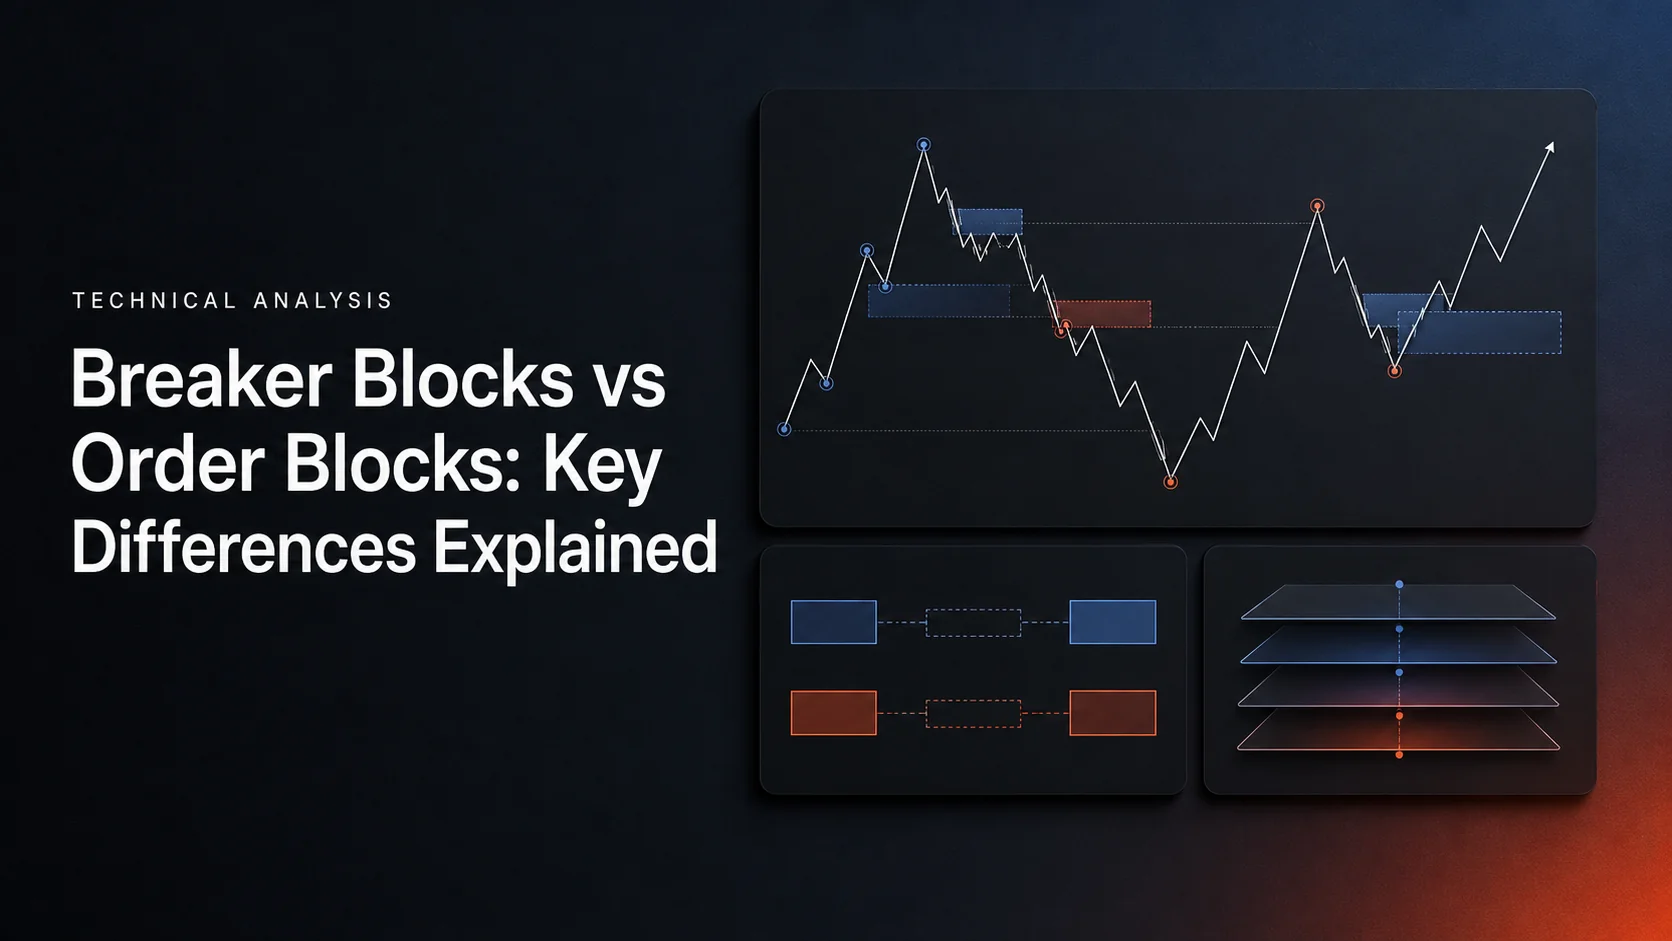
An order block is a defined price zone preceding a qualifying move; a breaker block is a failed order block evaluated for an opposite-role reaction. Under a common directional convention, a broken bullish OB becomes a bearish breaker candidate, while a broken bearish OB becomes a bullish breaker candidate.
The distinction is the zone’s history and state, not a universal split between “safe trending markets” and “risky volatile markets.” Either setup can participate in a continuation or reversal depending on the reference timeframe. Neither candle patterns nor volume metrics prove that institutions still hold orders at the zone.
On LuxAlgo’s charting and AI platform, use Quant Charts to inspect the original block, its failure and any retest. Ask Quant, our coding agent, to help implement and test those events as separate rules. That makes it possible to compare the two trade models without changing definitions after seeing the outcome.
Quick Comparison: Order Blocks vs Breaker Blocks
| Aspect | Order block | Breaker block |
|---|---|---|
| Origin | A zone defined before a qualifying displacement or structure break | An existing OB that has failed under a specified rule |
| Proposed role | Bullish support or bearish resistance | Opposite-role reaction at the failed zone |
| What must be known | Construction, confirmation time and invalidation boundary | Original OB, failure time and new directional hypothesis |
| Entry model | A defined return to or reaction at the still-eligible block | A defined retest or reaction after the block’s failure |
| Main failure | The zone breaks instead of holding | Price reclaims the failed zone or never offers a tradable retest |
| Risk planning | Size from entry to invalidation, plus costs and exposure limits | Recalculate from the new entry and stop; do not reuse the old trade’s risk |
What Are Breaker Blocks and Order Blocks?
What Are Order Blocks?
A common manual bullish OB is the last down candle before a significant upward move, while a bearish OB is the last up candle before a significant downward move. The significance of the move, search lookback and zone boundaries need definitions. Some indicators use swing structure or volume pivots instead, producing different zones.
The block is a candidate support or resistance area. It does not authenticate institutional accumulation, distribution or remaining liquidity. Bullish blocks can occur in uptrend continuations or after declines; bearish blocks can appear in the corresponding opposite situations. They are not limited to one market phase.
What Are Breaker Blocks?
A breaker begins with an identifiable prior OB that fails. If price breaks below a bullish block under the selected invalidation rule, that former support can become a bearish breaker candidate. If price breaks above a bearish block, former resistance can become a bullish breaker candidate.
This resembles the broader support/resistance role reversal described by Fidelity. The breaker framework adds the requirement that the original area qualified as an OB. A generic broken support level is not automatically a breaker under every OB method.
Distinguish breaker formation from trade confirmation. A tool may mark the breaker at the moment the OB fails. A trading rule may then require a later retest and rejection before entering. That retest does not make future success certain, and price can continue away without ever returning.
Some tools retain labels linked to the original block’s type rather than the new trade direction. Inspect the legend and rules. In this article, bullish or bearish breaker refers to the proposed new reaction, so the polarity is explicit.
How Breaker Blocks and Order Blocks Form
Formation of an Order Block
Start with a defined candle or zone, followed by sufficient displacement or a completed structural break. For example, require a close beyond a prior confirmed swing and mark the final opposing candle before that move. Decide whether the block uses the body, full candle range or another refinement.
A liquidity sweep, FVG or volume expansion can be an additional condition. These are not universally required by all OB algorithms. A sweep shows a move beyond a reference followed by a reaction; it does not reveal the identity or intent of participants. An FVG is a three-candle non-overlap, not proof that no trading occurred in the interval.
“Fresh” and “unmitigated” need operational meanings. A first touch, midpoint crossing and full boundary break are different events. If a strategy permits only the first retest, record that separately from the indicator’s rule for removing the zone.
Formation of a Breaker Block
- Establish the original OB: preserve its bounds, source timeframe and time of confirmation.
- Observe a qualifying failure: apply the chosen wick, close or other invalidation rule to that existing zone.
- Assign the new role: former bullish support becomes a bearish resistance hypothesis, or the reverse.
- Wait for the entry event: if the model requires a retest, define its permitted depth, confirmation and expiry.
- Handle failure again: specify when a reclaim invalidates the breaker and what happens to pending or open orders.
A breaker does not require price to break a level and then invalidate that same breakout. A sustained break through the original OB can create the polarity-flip hypothesis. A separate false breakout can occur, but conflating these events makes testing inconsistent.
Historical charts can conceal timing. A swing or volume-pivot block may be drawn at an earlier origin only after later bars confirm it. A breaker cannot become tradable before the original zone and its failure are actually knowable. Avoid using retrospective polarity annotations as earlier entry signals.
Formation Differences to Record
| Event | Order-block model | Breaker model |
|---|---|---|
| Origin | Selected opposing candle, swing zone or volume-pivot zone | The same original OB, retained after failure |
| Eligibility begins | After the formation rule is confirmed | After the failure rule is confirmed |
| Retest | Price returns toward the original support/resistance role | Price returns from the other side toward a proposed flipped role |
| Volume and sweeps | Optional filters unless required by the method | Optional context around the failure and retest |
| Invalidation | Selected boundary or mitigation rule fires | Selected reclaim/expiry rule fires |
| Information to retain | Origin candle plus later confirmation timestamp | Original block ID plus failure and retest timestamps |
Trading Applications: When to Use Each Concept
Order Blocks in Trend Continuation Strategies
In an uptrend, a bullish OB can define a pullback area to investigate; in a downtrend, a bearish block can define a rally-to-resistance hypothesis. Specify the trend rule and horizon rather than assuming the block’s color establishes the overall market direction.
A completed break of a previous swing, displacement away from the block and a first retest can form a testable sequence. A rejection wick or engulfing pattern can be a trigger if its geometry and close timing are explicit. An engulfing candle alone is not a universally reliable OB detector.
Stop placement often uses a level beyond the zone with a chosen buffer. A 2:1 reward-to-risk target is one possible rule, not an assurance that the trade has sufficient room. Check intervening opposing levels, spread and actual entry price before accepting the setup.
Breaker Blocks in Reversal and Continuation Strategies
A failed bullish block followed by a rejection from below can support a bearish trade hypothesis. That may reverse the local upward move while continuing a broader downtrend. The same breaker therefore can be a reversal on one timeframe and a continuation on another.
Preserve the original crude-oil example as a hypothetical setup: an identified bullish OB fails, the failed zone is retested from below, and a specified rejection permits a short. A stop above the breaker and a target three times the entry-to-stop distance define a 3R plan. Without actual prices, contract value and fill assumptions, this is a setup description rather than a verified trade result.
“USOil” can be a broker-specific symbol and is not interchangeable with the United States Oil Fund ETF. Check the instrument, contract specification and feed before calculating size or comparing examples. A 3:1 reward-to-risk target is a research choice, not a minimum that makes every breaker attractive.
Worked EUR/USD Breaker Example
Suppose a previously confirmed bullish OB spans 1.0740–1.0750. A completed break below 1.0740 makes it a bearish breaker candidate under the selected rule. Price later retests 1.0745 from below, with a planned stop at 1.0760 and target at 1.0700. These are hypothetical prices, not a documented historical EUR/USD trade.
| Item | Calculation | Practical implication |
|---|---|---|
| Planned distance to stop | 1.0760 − 1.0745 = 0.0015 = 15 pips | Risk is based on the actual short entry, not only the block height |
| Planned distance to target | 1.0745 − 1.0700 = 0.0045 = 45 pips | 45 ÷ 15 = 3:1 reward-to-risk before costs |
| Illustrative account budget | $10,000 × 0.5% = $50 | A chosen planned-loss budget, not a guarantee |
| Illustrative EUR/USD sizing | $50 ÷ $150 per 100,000 units ≈ 33,333 units | At 0.0001 USD per EUR per pip, round down to the permitted increment |
| Using 33,000 units | 15 × $3.30 = $49.50 risk; 45 × $3.30 = $148.50 reward | Exposure and margin requirements still need separate checks |
| Worse stop fill at 1.0770 | 25 pips × $3.30 = $82.50 loss | Slippage changes the realized loss to about 1.67R |
The sizing illustration assumes a USD-denominated account and a linear EUR/USD position with pip value determined by the number of euros held. Product minimums, broker rounding, spread, financing and execution can change the result. Recalculate when the account currency, contract or entry changes.
With full winners of 3R and losers of 1R, break-even is 25% before costs. At a 20% win rate, expectancy is 0.20 × 3R − 0.80 × 1R = − 0.20R. For a 2R/1R model, break-even is about 33.3% before costs. Neither a 2R nor 3R target substitutes for evidence about realized wins and losses.
How to Identify the Zones on Charts
Order-Block Identification Checklist
Record the qualifying move, origin candle or algorithmic zone, boundaries, confirmation time and invalidation method. If a consolidation or engulfing pattern is required, define it separately. Avoid retrospective claims that all professionals buy declines or sell rallies; aggregate candle patterns cannot establish that behavior.
Review the same rules on a representative sample across stocks, crypto, forex or futures. High volume in an asset does not make every OB dependable, and volume coverage differs between consolidated, exchange-specific and tick feeds. Preserve losing and unfilled setups alongside the best chart examples.
Breaker-Block Identification Checklist
Find the original OB first. Confirm its failure, identify the side from which a retest would approach, and state the proposed new role. A short wick through a boundary may count under one rule and not under a close-based rule.
Do not require the retest to fail in hindsight before deciding it was tradable. Use a completed rejection condition and the first realistic subsequent fill. Price can cut through the breaker, oscillate around it or continue without a retest; each outcome belongs in the record.
When to Use Breaker Blocks vs Order Blocks
Volatility Changes Execution, Not the Definition
Fast movement can make failures and polarity flips visually obvious, but it also increases the potential for slippage, gaps and repeated stop-outs. Breakers are not inherently best in high volatility, nor are OBs inherently dependable in calm trends. Test the specific entry model by regime.
Range-bound or low-volume conditions can produce ambiguous structure and small targets after costs. That is a reason to measure performance and execution quality, not a universal ban on either setup. Separate directional trend from volatility; a market can be trending quietly or ranging violently.
Choose the Horizon and Management Process
Daily and four-hour charts can provide broader context while hourly or lower charts refine an entry. Longer timeframes do not universally improve accuracy, and short timeframes are not automatically unsuitable. Match the choice to holding period, data and the time available to monitor orders.
Neither concept belongs exclusively to beginners, scalpers or swing traders. An OB strategy can be complex and risky; a breaker strategy can use slow, explicit daily rules. Select by tested behavior and execution demands rather than personality labels.
| Decision | What to specify for either model |
|---|---|
| Market context | Trend, volatility, liquidity, session and scheduled-event filters |
| Timeframes | The chart defining the zone and the chart controlling entry |
| Order style | Resting limit versus confirmation entry; expiry and cancellation |
| Risk | Invalidation distance, costs, quantity and maximum aggregate exposure |
| Evaluation | Out-of-sample results, failed retests, missed fills and drawdowns |
LuxAlgo Tools for Order Blocks and Breaker Blocks
Native Analysis and Strategy Testing on Quant Charts
The Order Blocks & Breaker Blocks Library tool uses swing structure and tracks a zone after failure. It offers Swing Lookback, bullish/bearish display limits, body-based zone construction and historical polarity labels. Those historical labels are backpainted study annotations and must not be used as earlier live signals.
The Order Block Detector follows a different volume-pivot method and removes mitigated blocks. It has a confirmation delay governed by Volume Pivot Length. Choose the tool that matches the hypothesis instead of assuming all OB indicators implement the same logic.
Ask Quant to help implement a small state sequence: original block confirmed, block invalidated, breaker eligible, retest confirmed, trade entered, and trade exited. Follow Making Strategies with Quant, inspect Code and click Run yourself. Use the native backtest guide to inspect trade timing, costs and individual fills.
Compare OB-only and breaker-only models under the same risk budget, instrument, costs and evaluation period. Then test any combined system. Two trades linked to the same failed zone are not independent evidence; include sequential losses and correlated exposure.
Use chronological training, validation and untouched evaluation data. Check nearby settings and whether results depend on a few outliers. A displayed block or alert is not automatically a strategy input; confirm that its logic is supported in the selected runtime. AI assistance can speed implementation, but it does not guarantee profitable settings.
Risk Controls for Both Concepts
Choose the invalidation rule before sizing. A stop beyond the zone with a volatility buffer may fit one strategy, but it is not a universal optimum. Wider stops require smaller quantities for the same planned cash loss, while tight stops can imply excessive notional exposure.
A commonly cited 1–2% risk range is not automatically conservative. On a $10,000 account it means $100–$200 of planned loss to a stop, before execution uncertainty. Review aggregate risk when several positions depend on the same trend or failed level.
Investor.gov explains that a stop becomes a market order when triggered, so the fill price is not guaranteed. Limit orders can remain unfilled. Include gaps, spread, slippage, financing and applicable contract specifications in the model.
Moving averages, RSI, candlestick triggers and Fibonacci retracements can supply additional conditions, but several price-derived indicators may duplicate the same information. Test their incremental contribution. Practice with historical tests and separate demo forward tests, retaining the original charts and rule versions.
LuxAlgo Order-Block Video Explainers
The LuxAlgo order-block video is a visual introduction to the concept. Treat it as a demonstration, separate from native Quant Charts strategy testing.
Conclusion: Compare the Rules, Not the Labels
An OB proposes a reaction at an eligible original zone; a breaker proposes an opposite-role reaction after that zone fails. Track the complete sequence, define when each event becomes knowable, and evaluate the entry and risk plan after costs. Quant Charts and Quant can help make that comparison explicit.
FAQs
What is the main difference between a breaker block and an order block?
An order block is an original zone defined before a qualifying move. A breaker is a failed order block evaluated for an opposite-role reaction. The original zone, failure rule and confirmation time must be identifiable.
Does a breaker block require a successful retest?
A tool can mark a breaker when the original block fails. A trading strategy may separately require a later retest and rejection before entering. The retest is an entry condition, not a guarantee of future success.
Are order blocks better in trends and breakers better in volatile markets?
Not universally. Either can support continuation or reversal hypotheses depending on timeframe and rules. Test each model by market condition and include the execution problems that volatility creates.
How should traders combine these zones with other indicators?
Give each condition a distinct role, such as trend context or a completed entry trigger, and compare it with the simpler baseline. Multiple price-derived indicators do not necessarily provide independent confirmation.
Can higher-timeframe zones be used for lower-timeframe entries?
Yes, if confirmation and data-retrieval timing are respected. A developing higher-timeframe candle cannot be treated as its final close, and projected indicator zones may differ in timing from the source chart.
How can LuxAlgo help compare order-block and breaker strategies?
Inspect the zone history on Quant Charts, ask Quant to help implement explicit state transitions and trade rules, inspect Code and click Run. Compare costs, trade timing, drawdowns and out-of-sample results.
References
LuxAlgo Resources
- Quant Charts
- LuxAlgo Quant
- Order Blocks & Breaker Blocks
- Order Block Detector
- Making Strategies with Quant
- Native Backtest Guide
External Resources
Read next