How to Find Order Blocks (OBs) in Trading
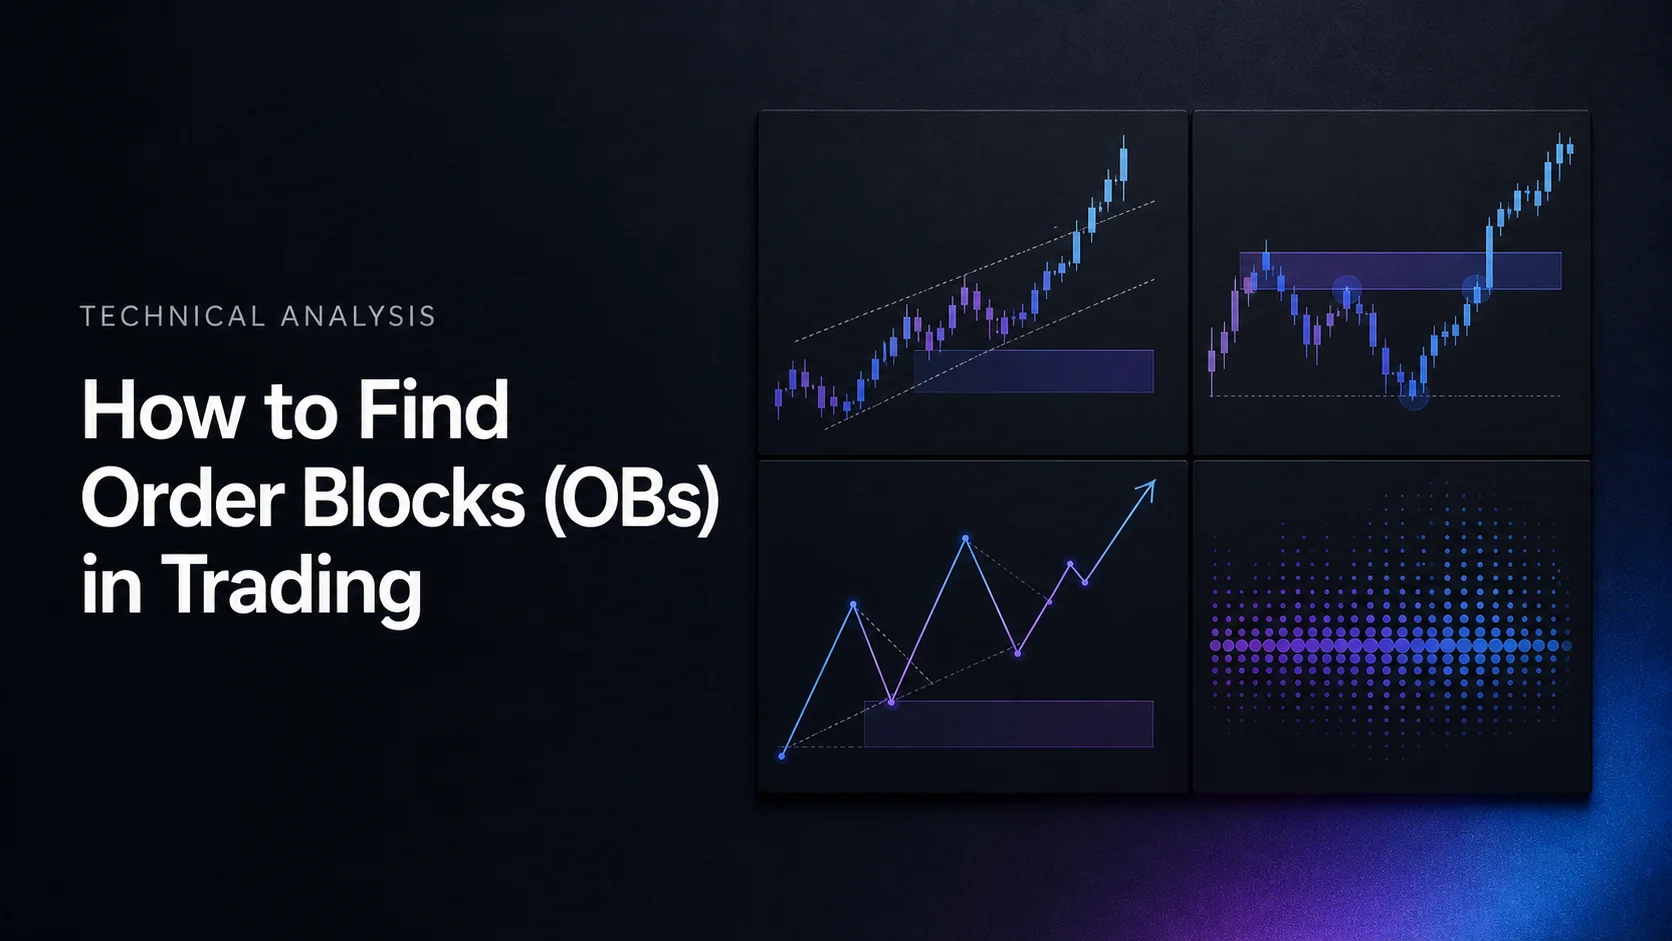
To find an order block, define a significant price move, identify the candle or zone that preceded it, and record the rule that confirms and invalidates that zone. A common manual method marks the last bearish candle before an upward displacement as a bullish order block, or the last bullish candle before a downward displacement as a bearish order block.
Order blocks are a price-analysis framework used in smart money concepts. Candles and aggregate volume do not reveal who placed orders, whether institutions still hold positions, or whether unfilled orders remain at a level. Treat an OB as a testable support or resistance hypothesis, rather than proof of institutional activity or a guaranteed reaction.
LuxAlgo’s charting and AI platform supports both visual analysis and strategy research. Inspect native order-block indicators on Quant Charts, then ask Quant, our coding agent, to help implement precise detection, entry, exit and risk rules. Keep the rules consistent when comparing manual examples with automated results.
Key Takeaways
- Identify the move first: require a defined displacement or completed structure break instead of labeling every opposing candle.
- Specify the zone: use the full candle range, body or another documented construction and keep it fixed.
- Separate confirmation from plotting: a zone drawn on an earlier candle may become knowable only after later bars.
- Test filters: volume, liquidity sweeps, FVGs and higher-timeframe context are conditions to evaluate, not proof of institutional orders.
- Plan failure: define mitigation, entry cancellation, stops, costs and total exposure before trading a retest.
Key Features of Order Blocks
Bullish and Bearish Order Blocks
A bullish OB is a candidate support zone preceding an upward move; a bearish OB is a candidate resistance zone preceding a downward move. The last-opposing-candle convention is widely used, but indicators may instead rely on swing points, volume pivots or multiple candles. Two tools can therefore draw different blocks without either reproducing the other’s definition.
Bullish blocks can occur during a reversal from a downtrend or as part of continuation in an uptrend. Bearish blocks have the corresponding opposite settings. The color of the selected candle alone cannot establish accumulation, distribution or the future direction of price.
| Feature | Bullish example | Bearish example | Rule to specify |
|---|---|---|---|
| Preceding candle | Last down candle before upward displacement | Last up candle before downward displacement | Which candle qualifies, and how far back to search |
| Confirmation | A completed break above a defined swing | A completed break below a defined swing | Close versus wick; swing confirmation delay |
| Zone | Candidate support below the move | Candidate resistance above the move | Body, full range or indicator-specific boundaries |
| Failure | Price crosses the chosen lower invalidation boundary | Price crosses the chosen upper invalidation boundary | Touch, wick, close or midpoint rule; order handling |
The Consolidation–Impulse Sequence
A common sequence begins with a relatively narrow consolidation, followed by displacement away from it. Define the range, minimum move and any required structure break numerically. A longer consolidation or smoother set of candles does not automatically make the eventual breakout stronger.
A sweep of a prior high or low may precede the move. This shows that price crossed a reference level and then reacted; the candle chart alone cannot confirm which stops were triggered or who caused the move. Similarly, an FVG describes a particular non-overlap in a three-candle sequence, not direct evidence of institutional execution.
Keep an original record of the zone when it first becomes eligible. Moving its boundaries after seeing the retest creates hindsight. An attractive historical reaction is not enough: include blocks that fail, never retest or become invalid before an order can fill.
How to Validate an Order-Block Setup
Validation means checking that a setup meets the chosen rules and evaluating its performance. It does not authenticate an institutional buyer or seller. The following filters address different questions and should be tested separately before combining them.
| Condition | What can be observed | What it does not establish |
|---|---|---|
| Volume peak | Unusually high activity under the available feed and lookback | Identity of participants or remaining orders |
| Unmitigated status | The chosen invalidation rule has not yet fired | That liquidity remains available at the zone |
| FVG / displacement | A defined non-overlap or unusually large move | A requirement that price return through the FVG |
| Liquidity sweep | A break and reaction around a prior high or low | Deliberate institutional stop hunting |
| Multi-timeframe context | The zone’s relationship to a broader chart structure | A universal improvement in accuracy or win rate |
The word mitigation varies across methods. Some traders use it for a first revisit; a tool may use a wick beyond the far boundary, a close beyond it or a midpoint crossing. State which meaning applies. A retest does not necessarily invalidate a block, and a hidden block is not proof that resting orders were consumed.
Step-by-Step Guide to Finding Order Blocks
1. Find the Range and Define a Completed Break
Mark a bounded consolidation or a relevant swing sequence on the timeframe being studied. Specify how many bars define it and what counts as displacement: for example, a completed close beyond a prior swing with a minimum movement threshold. An intrabar penetration can reverse before the candle closes.
As a hypothetical example, suppose a stock trades between $680 and $720, then closes above $720 with volume 35% above a stated recent average and later reaches $800. The range is $40 wide and the move from $720 to $800 is $80, or about 11.1%. These numbers illustrate how to document a range and breakout; they are not a verified account of TSLA’s Q3 2022 trading or a forecast based on volume.
The breakout identifies a move to investigate. It does not by itself locate the OB: the last qualifying opposing candle, its boundaries and its timing still need to be recorded. A range breakout and an order-block retest are different entry models.
2. Mark the Qualifying Candle and Boundaries
For the manual bullish convention, locate the last down candle before the qualifying upward move. For a bearish block, locate the last up candle before the downward move. Define whether a doji qualifies and whether the search stops at a previous swing or a maximum lookback.
Then select the full high–low range, body or another predefined refinement. A narrower body-based zone changes both touch frequency and stop distance; it is not automatically more precise. Record the confirmation time separately from the earlier origin candle so the strategy cannot enter before the block is detectable.
3. Add Fair Value Gaps as an Optional Filter
In a bullish three-candle FVG, the third candle’s low is above the first candle’s high. In a bearish FVG, the third candle’s high is below the first candle’s low. The middle candle typically carries the displacement through the interval, so this is not a claim that no trading occurred there.
For example, a first-candle high of $101 and third-candle low of $103 define a $101–$103 bullish non-overlap. The third candle must be complete before a closed-bar rule can confirm it. The FVG may be near an OB without sharing exactly the same boundaries.
Decide whether the FVG must form during the initial displacement, overlap the block or simply occur within a specified distance. Compare the OB strategy with and without that requirement. Price may never return, and a return can pass straight through both zones.
4. Track the Retest and Invalidation State
Separate formation, confirmation, first touch and invalidation in the record. If the rule permits only the first retest, stop generating new entries after that event. If it allows several attempts, cap the number and include all associated losses and costs.
A zone formed on a daily chart may be projected onto an hourly chart for execution, but the daily candle is not final during the session. Use only the higher-timeframe information available at the entry time. The precision of a lower-timeframe fill does not remove the delay in confirming the higher-timeframe setup.
Tools and Indicators for Automated Order Block Detection
Native Order Block Detector on Quant Charts
LuxAlgo’s Order Block Detector uses confirmed volume pivots rather than the manual last-opposing-candle rule alone. Its documented bullish zones extend from the candle low to the high–low midpoint, while bearish zones extend from that midpoint to the high. It also plots an average level within each zone.
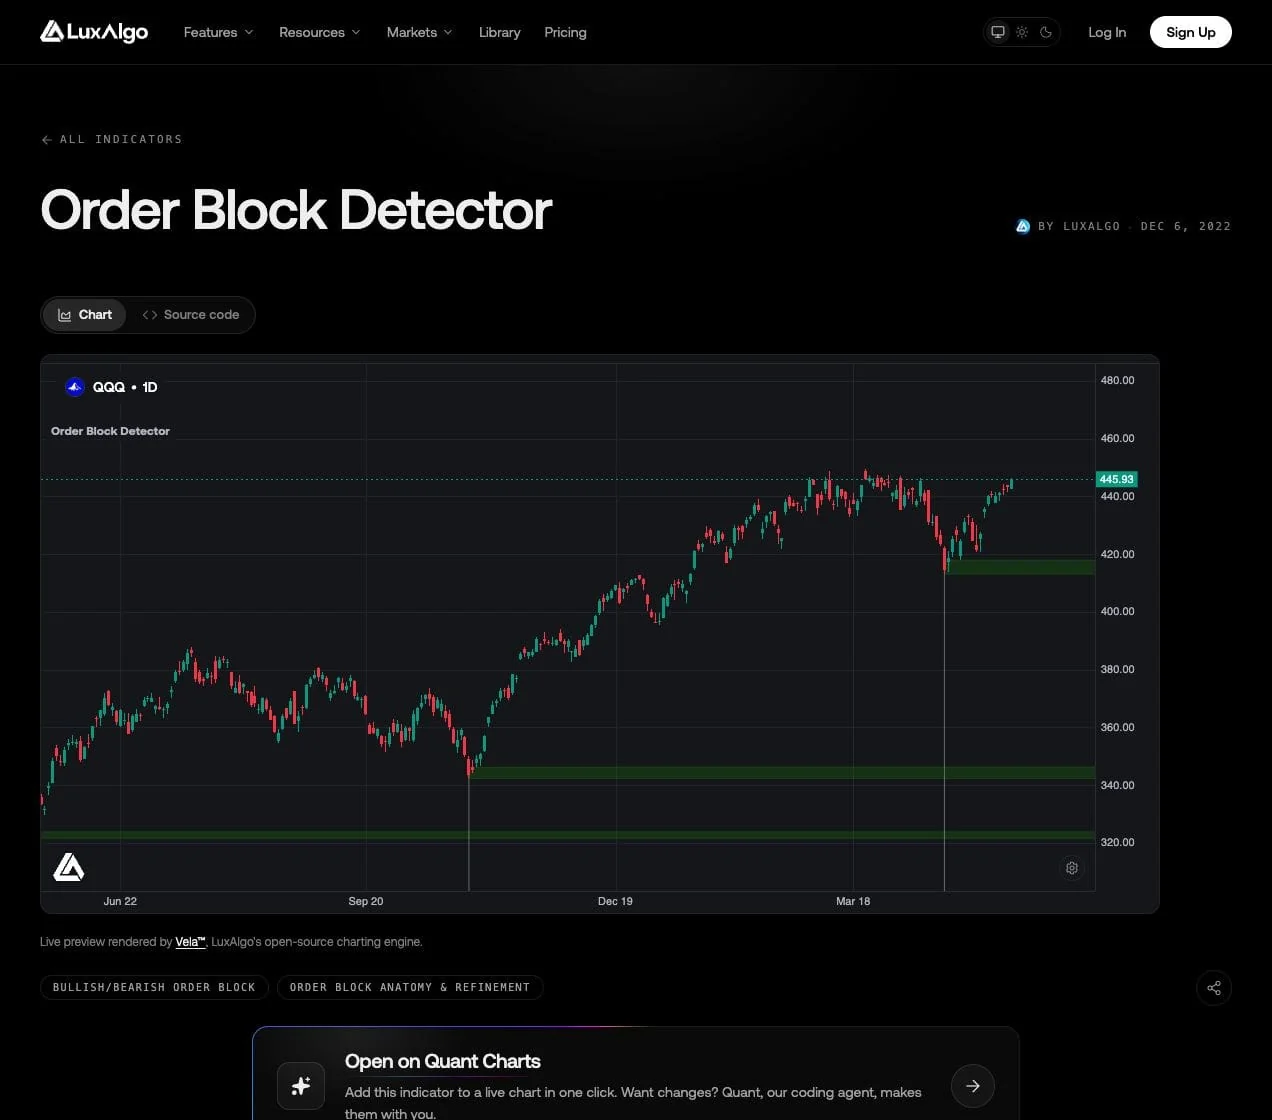
Volume Pivot Length creates a confirmation delay. A peak is recognized only after the required later bars, and the zone is then drawn back at its origin. A backtest must use the recognition time, not the earlier plotted position. Lower settings can confirm sooner and produce more blocks, but that does not prove better trading performance.
Separate bullish and bearish display limits control how many recent unmitigated blocks are shown. Wick mitigation removes a zone after price trades beyond the relevant boundary; Close mitigation waits for a closing-price break. Documented alerts cover creation and mitigation. Availability of a chart alert does not automatically mean an executable strategy can consume that event without implementing the logic.
The related Order Blocks & Breaker Blocks uses swing structure and retains broken zones as potential polarity-flip areas. Its historical polarity labels are backpainted study annotations. Do not treat those retrospective labels as signals that were visible at the earlier swing.
Volume Profile and Moving Averages
Volume Profile adds context by showing recorded activity at price levels over a selected interval. High Volume Nodes identify relatively active areas; they are not a map of resting liquidity. The Point of Control is the highest-volume row, while the Value Area covers a chosen share of profile volume, commonly 70%.
TradingView’s Volume Profile guide explains that input data and up/down classifications vary with the instrument and calculation. Forex tick volume counts price updates rather than consolidated market transactions. Match the feed, session, price rows and profile range when comparing results.
An OB near a profile node is a confluence hypothesis to test, not an automatic validation. EMA direction or a longer moving average can define trend context, but an EMA crossover does not itself create a block under the candle, swing or volume-pivot definitions. Add a condition only if it supplies useful incremental evidence.
Build and Test Order-Block Rules with Quant
Write the strategy before optimizing it: define the block construction, confirmation delay, permitted retests, entry order, expiry, stop, target, costs and exposure limits. Ask Quant to help implement those rules, inspect Code and click Run yourself. Use Making Strategies with Quant and the native backtest guide to review the implementation and trade list.
Compare the unfiltered OB model with versions adding an FVG, a sweep or a trend condition. Use chronological training and evaluation periods, untouched final data, nearby parameter checks and realistic fill assumptions. Measure expectancy, drawdown, profit factor, exposure and trade count rather than maximizing win rate alone.
For illustration, 40 wins of 2R and 60 losses of 1R total +20R across 100 trades before costs. At 0.1R cost per trade, the total becomes +10R. At a 30% win rate with the same payoffs, expectancy is −0.1R per trade before costs. An appealing target multiple is insufficient without the associated win/loss distribution.
Trading Strategies for Order Blocks
Timeframe Selection and Chart Setup
Daily, four-hour and weekly charts can provide broader context; hourly, 15-minute or five-minute charts can define more detailed execution. The appropriate choice depends on holding period, instrument and testing. Higher timeframes are not universally stronger, and lower-timeframe OB identification is not inherently invalid.
A consistent workflow might mark a completed daily block, then require an hourly retest trigger. Specify whether the hourly entry must align with the daily trend or is allowed to trade a reversal. Compare both approaches if relevant. Avoid switching timeframes only because another chart makes the failed setup look successful.
Entry and Exit Rules
Choose between a resting limit entry at a defined level and a confirmation entry after a specified reaction. The limit model may obtain a better price but can fill during a failure or never fill at all. The confirmation model delays entry and may reduce the available reward. They require separate performance tests.
A rejection wick or reversal candle can be an entry condition if precisely defined. A desired move of two or three times the block’s height is a target hypothesis; price movement that happens after entry cannot be used as information available when choosing that entry.
Set a stop beyond the chosen invalidation level with a stated buffer. A structural target, Fibonacci extension or fixed R target must be defined before the trade. Nearby opposing zones can limit the available room. Specify whether partial exits, trailing stops and time exits are used and how they interact.
Risk Management and a Worked OB Retest
A 1–2% risk budget on a $10,000 account equals $100–$200 of planned loss, not $100–$200 of position value. That range is a convention rather than a universally conservative allocation. Choose the budget from the strategy and portfolio risk, then calculate quantity from the entry-to-stop distance.
Suppose a bullish block spans $98–$100. A hypothetical limit entry at $100 uses a stop at $97.50 and a target at $105. With a $100 planned price-risk budget, the distance to the stop is $2.50 per share.
| Scenario | Calculation | Meaning |
|---|---|---|
| Original limit plan | $100 ÷ $2.50 = 40 shares | Planned loss $100; notional exposure $4,000 |
| Target reached | 40 × ($105 − $100) = $200 | 2R gross reward before costs |
| Stop fills at $97 | 40 × ($100 − $97) = $120 loss | 1.2R realized loss before costs |
| Confirmation entry at $101 | ($105 − $101) ÷ ($101 − $97.50) ≈ 1.14R | Same zone and target, different trade economics |
| Revised quantity at $101 | Floor($100 ÷ $3.50) = 28 shares | Planned price risk $98; notional exposure $2,828 |
Investor.gov’s order guide explains that a triggered stop becomes a market order, whose execution price is not guaranteed. A limit order can remain unfilled. Include spread, fees, slippage, gaps and partial fills; do not model every touch as an automatic fill at the best price.
Contract products require their point value and currency conversion. Cap notional exposure as well as planned stop risk, and review correlated positions across markets. Do not add to a losing OB trade simply because another nearby candle can be labeled as a new block.
Historical backtesting and demo forward testing serve different purposes. Backtesting evaluates past data; forward testing records decisions as new information arrives. Use both to inspect confirmation delay, order handling and the practical ability to follow the rules.
Common Problems and Solutions
False Breakouts and Liquidity Grabs
A completed OB can fail. Calling every failed zone “fake” after the event hides the strategy’s loss rate. Preserve every qualifying detection, including those with a sweep, volume peak or FVG that still break down.
Require a stated formation rule rather than treating every consolidation as an OB. If a rejection on retest is part of the entry rule, wait for its completion. If the strategy enters before that confirmation, include the additional failure exposure in the test.
Ignoring Market Context
Trend, volatility, liquidity, sessions and scheduled news can change the conditions around a zone. Define any news exclusion or trend filter before reviewing results. A block can become invalid during a large gap without offering a tradable exit at the planned boundary.
Trend-aligned and counter-trend blocks are different hypotheses, not universal high- and low-probability categories. In ranges, a zone near a boundary may matter; in a persistent move, a newly formed block may never be revisited. Record both missed opportunities and losing retests.
Using Too Many Indicators
Use a small set of tools with distinct jobs: one for zone definition, one for market context and any separately justified execution filter. Two or three indicators can still duplicate the same price information. Compare each addition with the simpler model and account for the reduced sample size.
Keep your workspace readable and retain the settings used for each test. Changing thresholds after every loss can make the chart look better without improving future decisions. Review changes on a fixed schedule and keep earlier strategy versions available.
How to Identify and Trade Order Blocks
This existing video offers another visual explanation of order-block setups. Evaluate its examples using explicit confirmation, invalidation and execution rules rather than assuming a marked zone identifies an institution.
Conclusion and Key Takeaways
Summary of Techniques
Find the qualifying displacement, mark the origin under one consistent definition, and distinguish the candle’s location from the time its block became confirmed. Use FVGs, sweeps, volume and multi-timeframe context as filters whose contribution must be measured. Track the block through touch, entry and invalidation rather than keeping only attractive reactions.
Quant Charts provides native tools for inspecting these zones, while Quant can help implement and test a repeatable model.
Final Tips for a Repeatable Process
Keep the original chart and settings, size from invalidation, test realistic orders and review results after costs. Stocks, forex, futures and crypto differ in volume coverage, contract economics and trading hours, so transfer the framework carefully. The useful result is a strategy with documented behavior, not confidence based solely on an institutional narrative.
FAQs
How can I tell if an order block is valid or a false signal?
Check whether it meets a predefined formation and confirmation rule. Volume, sweeps and FVGs can be tested as filters, but they do not prove institutional activity. A valid setup can still lose, so retain all qualifying detections in the evaluation.
What are FVGs and how do they relate to order blocks?
A bullish FVG has the third candle’s low above the first candle’s high; a bearish FVG has the third candle’s high below the first candle’s low. It may accompany an order-block displacement, but does not guarantee a retest or imply that no trades occurred in the interval.
Are higher-timeframe order blocks always more accurate?
No. They describe broader structure and may suit longer holding periods, but performance depends on the rules and market. Respect higher-timeframe confirmation and data-retrieval timing when executing on a lower chart.
What is the difference between mitigation and a first touch?
A first touch is a revisit to the zone. Mitigation depends on the selected method and may require a wick, close or average-level crossing. A touch does not necessarily invalidate a block or prove remaining orders have been consumed.
Why does an order-block indicator draw zones on earlier candles?
Pivot-based tools may need later bars to confirm the origin. The earlier plotted candle is different from the first time the signal was knowable. Historical tests must wait for confirmation before permitting an entry.
How can LuxAlgo help test an order-block strategy?
Inspect native blocks on Quant Charts, ask Quant to help implement explicit detection and trade rules, inspect Code and click Run. Compare the trade list, costs and out-of-sample results with a simpler baseline.
References
LuxAlgo Resources
- Quant Charts
- LuxAlgo Quant
- Order Block Detector
- Order Blocks & Breaker Blocks
- Making Strategies with Quant
- Native Backtest Guide
External Resources
Read next