
Learn essential trading patterns, including continuation and reversal strategies, to enhance your trading skills and make informed decisions.
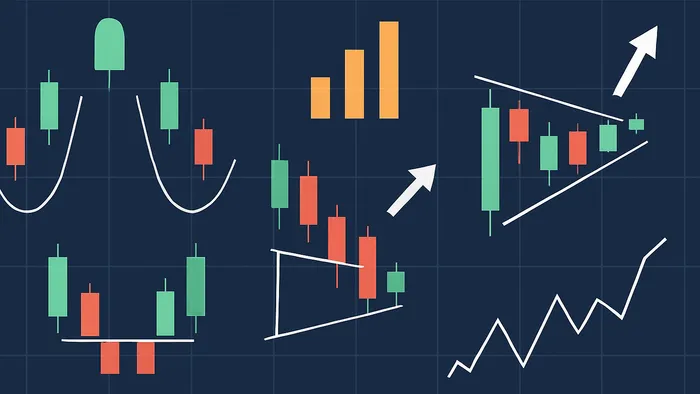
- Continuation Patterns: These signal that a trend will likely continue after a pause. Examples include flags, pennants, and wedge structures.
- Reversal Patterns: These indicate a potential change in trend direction. Key examples include head and shoulders formations and double tops/bottoms.
- Volume Analysis: Always check volume—patterns confirmed by higher volume during breakouts are more reliable.
- Timeframes: Start with daily or weekly charts for clearer signals, then explore shorter timeframes as you gain experience.
- Risk Management: Use stop-loss orders and limit your risk to 1–2 % of your capital per trade.
Pro Tip: Combine patterns with indicators like RSI or moving averages to confirm your trades.
Quick Comparison of Key Patterns
| Pattern | Type | Key Signal | Trading Strategy |
|---|---|---|---|
| Head & Shoulders | Reversal | Price breaks below neckline | Enter short, stop-loss above right shoulder |
| Double Tops/Bottoms | Reversal | Break above/below neckline | Enter after breakout, confirm with volume |
| Flags & Pennants | Continuation | Breakout from consolidation area | Trade in trend direction, target flagpole height |
These patterns are beginner-friendly and widely used. For a broader overview, read LuxAlgo’s essential guide to classic chart patterns. Start with one pattern, practise on historical data, and refine your skills with a demo account before trading live.
The Best Chart Patterns To Trade (Reliability Study)
Trading Pattern Fundamentals
Understanding trading patterns is a key skill for beginners, helping them anticipate price movements and make smarter decisions.
Types of Patterns: Continuation and Reversal
Trading patterns fall into two main categories—continuation and reversal—each offering valuable insight into market behaviour:
- Continuation Patterns: These appear during brief pauses in an ongoing trend, signalling that the trend is likely to resume. Common examples include flags and pennants, which often form during strong market moves.
- Reversal Patterns: These indicate a potential trend reversal, showing a shift in control between buyers and sellers. Spotting and confirming these patterns is critical for timing trades effectively.
| Pattern Type | Characteristics | Trading Approach |
|---|---|---|
| Continuation | Develops in line with the existing trend | Wait for a breakout and trade with the trend |
| Reversal | Forms opposite to the current trend | Enter after the pattern completes and key levels break |
Volume Analysis in Pattern Trading
Volume plays a vital role in confirming the validity of patterns and filtering out false signals.
“It is not advisable to rely solely on price patterns for your technical analysis. Combining this information with more identifiers, like technical indicators and trading tools, can be a more effective way of improving your trading strategy and positions in the market.”
- Milan Cutkovic, Axi
| Volume Signal | Interpretation | Action to Take |
|---|---|---|
| 1.5–2 × Average | Moderate strength | Monitor closely |
| 2–3 × Average | Strong confidence | Consider entering a trade |
| 3 × + Average | Very strong conviction | Aggressive entry may be justified |
Selecting Pattern Timeframes
Daily and weekly charts are ideal starting points for beginners because they provide clearer signals and reduce noise. Once you’re comfortable, shorter timeframes can be layered on for more dynamic opportunities.
When choosing timeframes, consider:
- Your trading style (e.g. day trading vs. position trading)
- The time you can dedicate to monitoring markets
- The typical duration of the pattern
- Volume trends across different periods
Stocks that trade over 500 000 shares daily generally form more reliable patterns. Higher liquidity reduces the risk of false breakouts and improves execution.
For added confidence, align patterns across multiple timeframes. This approach can help confirm potential trades and improve your overall success rate. These basics lay a solid foundation for applying trading patterns in live markets.
3 Must-Know Trading Patterns
These three formations build on the basics of pattern recognition and provide actionable entry and exit strategies.
Trading the Head and Shoulders Pattern
The head and shoulders pattern is a classic reversal setup that suggests a potential shift from an upward trend to a downward trend. It’s characterised by three peaks: the middle peak (the head) is the tallest, flanked by two shorter peaks (the shoulders).
| Component | Characteristics | Trading Significance |
|---|---|---|
| Left Shoulder | The first peak in an up-trend | Establishes the baseline of the pattern |
| Head | The highest peak | Marks the top of the trend |
| Right Shoulder | Similar height to the left | Indicates weakening upward momentum |
| Neckline | Connects the lows of the pattern | Serves as the critical breakout level |
How to trade it:
- Wait for the full formation of both shoulders and the head.
- Enter a short position when price breaks below the neckline.
- Place a stop-loss above the right shoulder.
- Set a profit target by measuring the distance from the head to the neckline and projecting it downward.
“Start thinking of patience as part of your trading edge. It’s no longer just something you’re supposed to have to do. It’s something you have to do to stack the odds in your favour.” – Justin Bennett, Author
Using Double Tops and Bottoms
Double tops and bottoms are powerful reversal patterns that often appear at market extremes. When spotted correctly, these patterns have shown success rates of 65–75 %.
For example, in late 2018, Amazon (AMZN) formed a double top near $2 050, with support at $1 880. Once price broke below support, AMZN dropped by 31 %.
| Pattern Type | Entry Signal | Stop-Loss Placement | Target Setting |
|---|---|---|---|
| Double Top | Break below the neckline | Above the second peak | Measure distance from peaks to neckline |
| Double Bottom | Break above the neckline | Below the second trough | Measure distance from troughs to neckline |
These patterns are most effective when combined with volume analysis to confirm breakouts.
Trading Flags and Pennants
Flags and pennants are continuation patterns that signal a temporary pause during strong trends before the trend resumes. They’re particularly useful for traders aiming to capitalise on momentum.
Take Tesla (TSLA) as an example. The stock surged from $200 to $240, then formed a bullish flag. After consolidating between $230 and $240, TSLA broke out and climbed to $276, matching the height of the flagpole.
Key steps for trading flags and pennants:
- Look for strong momentum moves backed by high trading volume.
- Identify consolidation areas—flags (a channel against the trend) or pennants (a symmetrical triangle).
- Wait for a breakout confirmation with increased volume.
- Set your target by measuring the flagpole’s height and projecting it in the breakout direction.
These patterns typically develop over one to four weeks. Pairing them with disciplined risk management and careful volume analysis can significantly improve your trading outcomes.
Pattern Trading in Practice
Trading patterns can be a game-changer when paired with solid technical analysis and smart risk management. Let’s dive into how you can use these patterns effectively in real-world scenarios.
Adding Technical Indicators to Patterns
Indicators help bring clarity to pattern formations. Pairing different categories improves precision. To scan multiple assets quickly, the LuxAlgo Screener (PAC) can surface fresh pattern setups in real time.
| Pattern Type | Trend Indicator | Secondary Indicator | Volume Confirmation |
|---|---|---|---|
| Head & Shoulders | Moving Average | RSI (momentum/divergence) | Rising OBV during breakout |
| Double Bottom | Moving Average | MACD crossover | High volume on the second bottom |
| Bull Flag | ADX (trend strength) | Stochastic Oscillator | Volume drops within the flag |
Tips for implementation:
- Start with one trend indicator and one momentum oscillator.
- Use volume analysis to confirm breakouts.
- Look for divergences between price action and momentum indicators.
Pattern-Based Risk Management
Incorporating reversal patterns with relative strength indicators can improve success rates to as high as 76 %.
| Risk Component | Recommended Setting | Why It’s Important |
|---|---|---|
| Position Size | 1–2 % of total capital | Keeps potential losses manageable |
| Stop-Loss | 1.5 × volatility range | Accounts for normal price fluctuations |
| Take-Profit | Pattern-height projection | Aligns with the expected move based on the pattern |
For highly volatile stocks, longer-term moving averages can help avoid premature stop-loss triggers. A common rule of thumb is to place stop-loss orders at least 1.5 times the current high-to-low range.
Testing Pattern Success Rates
Testing strategies with historical data is critical to understanding reliability. Studies show:
- Bullish Flags: 75 % success in predicting upward moves
- Cup and Handle: 76.3 % success in continuing trends
- Diamond Tops: 69 % success in forecasting reversals
To test effectively:
- Record trades—entry, exit, outcome, and market context.
- Stick to strict rules to minimise emotional decisions.
- Run systematic backtests across varying market conditions.
Automate deeper analysis with LuxAlgo’s PAC Backtester or the fully hosted AI Backtesting platform to iterate quickly on strategy ideas.
Conclusion: Next Steps in Pattern Trading
To excel in pattern trading, refine your approach consistently. Success isn’t just about spotting patterns—it’s about discipline, ongoing education, and strategic execution.
Start with the Basics
Master one pattern at a time and stick to a single timeframe. Practise in a demo account first to gain experience without risking capital.
Follow a Step-By-Step Learning Plan
| Phase | Focus Area | Key Activities |
|---|---|---|
| Foundation | Single Pattern | Practise spotting patterns on historical charts |
| Intermediate | Pattern Combinations | Integrate technical indicators for confirmation |
| Advanced | Strategy Development | Create and test risk-management strategies |
| Professional | Portfolio Integration | Scale positions based on reliability and results |
Use Technology to Your Advantage
Modern platforms streamline analysis. LuxAlgo’s TradingView Toolkits offer real-time pattern detection, liquidity zones, and more, while AI Backtesting can automatically generate strategy concepts.
Establish a Solid Trading Framework
Discipline is key. Stick to strict risk controls—risking only 1–2 % per trade—and keep detailed trade records. Review performance regularly and stay informed about market conditions.
Focus on Smart Position Sizing
For day trading, you’ll need to meet the $25 000 minimum balance requirement, though many experts suggest starting with roughly $100 000 for full-time trading. Prioritise steady, incremental gains over chasing big wins.
FAQs
How can I combine trading patterns with technical indicators to improve my strategy?
To boost your strategy, pair chart patterns with technical indicators that complement them. For instance, when spotting a head and shoulders pattern, momentum tools like RSI or MACD can confirm whether a reversal is likely. Volume indicators are equally important—when combined with patterns like double tops or flags, they clarify the conviction behind a breakout or reversal.
What are some common mistakes beginners make when analysing volume in trading patterns?
Beginners often stumble by:
- Over-reacting to volume spikes: Short-term noise can be mistaken for meaningful signals.
- Ignoring low-volume periods: Quiet phases still carry information about supply-and-demand shifts.
- Assuming high volume is always bullish: Volume must be analysed alongside price action and trend context.
How can I adjust my risk management strategy when moving from demo trading to live trading?
Transition slowly: start with a small live account to temper emotions, use uncompromising stop-loss orders, avoid over-leveraging, and adhere to a clear trade plan. Focus on consistency and measured growth rather than quick wins.
References
- Reversal Spotting Made Easy – LuxAlgo
- Double Tops & Bottoms – LuxAlgo
- Volumetric Toolkit – LuxAlgo Library
- Moving Averages – LuxAlgo
- Oscillator Matrix Reversal Signals – LuxAlgo Docs
- Breakouts with Tests & Retests – LuxAlgo Library
- Head & Shoulders Pattern – LuxAlgo
- Trend Lines Indicator – LuxAlgo Library
- LuxAlgo Homepage
- Wedge Patterns Guide – LuxAlgo
- AI Backtesting Assistant – LuxAlgo
- LuxAlgo TradingView Toolkits – Overview
- LuxAlgo Screener (PAC) – Indicator
- PAC Backtester – LuxAlgo Docs
- Classic Chart Patterns – LuxAlgo
- Relative Strength Index – Wikipedia
- MACD – Investopedia
- Reliability Study Video – YouTube
- Amazon
- Tesla
- Axi


