

Learn how reversal candles can help identify market turning points and improve your trading strategy with key patterns and confirmation techniques.
Reversal candles are powerful tools in trading, helping you spot when markets might change direction. These candlestick pattern-detection indicators reveal shifts in buyer and seller momentum, making it easier to time your trades effectively. Here is what you need to know:
- What They Do: Reversal candles signal potential trend changes, offering clues for entry and exit points.
- Key Types:
- Hammer: Bullish reversal in a downtrend.
- Shooting Star: Bearish reversal in an uptrend.
- Engulfing: A two-candle pattern showing a strong reversal.
- Why They Work: These patterns reflect the psychology of buyers and sellers at critical price levels, often confirmed by volume spikes.
To use them effectively, combine reversal candles with other indicators like Ultimate RSI, moving averages, and Price Action Concepts support or resistance levels. Always validate patterns across multiple timeframes and manage your risk carefully. Reversal candles can help you trade smarter and identify market turning points with greater confidence.
The Ultimate Candlestick Patterns Trading Course for Beginners
How Reversal Candles Form
Reversal candles emerge from the interaction between buyers and sellers, often signaling potential shifts in market trends. Let us break down their key components and the psychology behind these patterns.
Parts of a Reversal Candle
A reversal candle has three main components, each reflecting the price movements during a trading session:
| Component | Description | Significance |
|---|---|---|
| Body | The range between opening and closing prices | Shows whether buyers or sellers controlled the session. |
| Upper Shadow | Distance from the top of the body to the high | Represents the session’s highest price. In bearish patterns such as a shooting star, a long upper shadow shows buyers lost momentum. |
| Lower Shadow | Distance from the bottom of the body to the low | Reflects the session’s lowest price. In bullish patterns such as a hammer, a long lower shadow indicates buyers regained control. |
For example, a hammer in a downtrend, characterized by a small body and a long lower wick (at least one third of the candle’s size), signals that sellers initially dominated but buyers regained strength by the close.
Market Psychology Behind Patterns
The psychology behind reversal patterns reveals the tug of war between bulls and bears at critical price levels.
"A battle between bulls and bears plays out within the wicks, while the body represents who gained more ground during this struggle." - TradingwithRayner Editorial
This dynamic is evident in several ways:
- Small Bodies: Reflect indecision or balance between buyers and sellers.
- Long Wicks: Highlight strong price rejections at extreme levels.
- Position in Trend: Patterns formed after prolonged moves are often more impactful.
- Volume Confirmation: Higher trading volume during pattern formation suggests stronger market conviction.
For instance, a shooting star after an uptrend signals fading buying power. Its long upper wick shows that while buyers initially drove prices higher, sellers took over, forcing a close near the session low.
Similarly, a hammer with increased trading volume suggests decisive buyer action, strengthening the likelihood of a trend reversal. To confirm these signals, consider using other technical indicators and analyzing the broader market context.
Three Main Reversal Candle Patterns
Learn how to spot market turning points with these three essential candle patterns.
Hammer Patterns
Hammer patterns indicate potential bullish reversals during downtrends. Here is what to look for:
| Component | Characteristic |
|---|---|
| Body | Small and positioned near the top |
| Lower Shadow | 2-5 times the length of the body |
| Upper Shadow | Minimal or none |
When a hammer appears with a long lower shadow (2-5 times the body length) and little to no upper shadow, it suggests a reversal. A bullish hammer (often green) near key support or Fibonacci retracement levels becomes more reliable if followed by a bullish close above its high, especially with rising volume.
"The hammer candlestick helps swing traders enter long positions after downtrends while minimizing the risk of catching a falling knife." - Investopedia
Next, let us explore how the shooting star pattern signals the opposite effect during uptrends.
Star Patterns
Shooting star patterns signal bearish reversals in uptrends. Here is how to identify them:
- Small body near the lower end
- Upper shadow at least twice the body length
- Minimal lower shadow
- Found at the peak of an uptrend, often near resistance levels, with high trading volume
When this pattern forms near resistance and is paired with high volume, it confirms bearish sentiment and suggests a potential downward move.
Now, let us look at a two-candle structure that provides a clear reversal signal.
Engulfing Patterns
Engulfing patterns consist of two candles, where the second completely covers the first, signaling a reversal.
| Pattern Type | Formation | Market Signal |
|---|---|---|
| Bullish Engulfing | A red candle engulfed by a larger green candle | Suggests a potential upward reversal |
| Bearish Engulfing | A green candle engulfed by a larger red candle | Suggests a potential downward reversal |
"Engulfing candlestick patterns are comprised of two bars on a price chart. They indicate a market reversal when the second candlestick completely covers or engulfs the length of the previous bar." - Becca Cattlin, Financial writer
For added strength, look for a lower shadow at least twice the body length, particularly when these patterns form near critical support or resistance areas.
Confirming Reversal Signals
Trend and Momentum Checks
To confirm reversal signals, start by examining broader market conditions with tools such as the Signals & Overlays indicator. A good first step is analyzing volume to assess the strength of the signal.
| Pattern | Volume | Strength |
|---|---|---|
| Engulfing | 2x spike | High |
| Hammer or Star | Spike | High |
| Doji | Build up | Moderate |
Choose timeframes that match your trading approach:
| Trading Style | Primary | Confirmation | Context |
|---|---|---|---|
| Scalping | 5-15 min | 1 hour | 4 hour |
| Day Trading | 1 hour | 4 hour | Daily |
| Swing Trading | 4 hour | Daily | Weekly |
| Position Trading | Daily | Weekly | Monthly |
When multiple indicators align with a volume spike, the reliability of the signal improves:
| Indicator | Volume | Strength |
|---|---|---|
| RSI Divergence | 2x Spike | High |
| MACD Crossover | Sustained | Strong |
| Moving Averages | Rising | Moderate |
| Support or Resistance | Breakout | High |
Indicators like Adaptive MACD or Ultimate RSI add momentum confirmation to reversal candles.
Price Level Analysis
Key price levels act as critical zones where buying or selling activity has historically been strong. Reversal signals gain more credibility when they appear near these levels.
| Reversal Type | Key Signals | Risk Management |
|---|---|---|
| Support to Resistance | Lower highs, failed breaks above | Stops above resistance |
| Resistance to Support | Higher lows, successful retests | Stops below support |
The Liquidity Zones guide explains how dynamic levels improve pattern reliability. In February 2025, LuxAlgo AI Backtesting added pattern-recognition that streamlines confirmation at these zones.
Trading with Reversal Candles
Entry and Exit Guidelines
Identifying precise entry and exit points is crucial for trading success. Always wait for confirmation from the next candle and be sure the market conditions support the trade.
| Pattern Type | Entry Point | Stop Loss |
|---|---|---|
| Bullish Engulfing | Enter above the pattern high after confirmation | Place stop below the pattern low |
| Bearish Engulfing | Enter below the pattern low after confirmation | Place stop above the second candle’s high |
| Hammer or Hanging Man | Enter after confirmation from the next candle | Position stop beyond the candlestick shadow |
Key factors for setting up trades:
- Pattern Validation: Align entries with trends on higher timeframes.
- Volume Analysis: Look for volume spikes during the pattern’s formation.
- Support or Resistance Levels: Only trade patterns forming at critical price levels.
For instance, a Morning Star pattern on the AUD / USD 4-hour chart aligned with a support level and confirmed momentum, illustrating the importance of these guidelines.
Risk Management Rules
After defining your entry setup, focus on managing risk to limit potential losses. A good rule of thumb is to risk no more than 1-2 percent of your total capital on any single trade.
- Position Scaling: Start with a smaller position and increase it as confirmation strengthens.
- Multiple Timeframe Analysis: Coordinate entries with signals from both daily and 4-hour charts.
- Trend Alignment: Favor reversals that align with the dominant trend.
- Dynamic Trailing Stops: The Market Structure Trailing Stop, Statistical Trailing Stop, and FVG Trailing Stop adapt stops to volatility, helping lock in profits as trends develop.
A Tweezer Top on the EUR / USD 4-hour chart showed a clear reversal below resistance. Traders who placed stops above the pattern highs and scaled their positions managed risk effectively as the reversal unfolded.
Tools for Finding Reversal Patterns
Timeframe Analysis Methods
Analyzing multiple timeframes enhances your ability to spot reliable reversal signals. A top-down approach works best: start with higher timeframes to understand the overall market trend, then zoom in to identify specific entry points.
| Timeframe Level | Purpose | Key Focus |
|---|---|---|
| Daily or Weekly | Identify primary trends | Major support or resistance zones, reversals |
| 4 Hour | Confirm trend direction | Validate pattern formations |
| 1 Hour | Pinpoint entry timing | Spot precise reversal candle signals |
Higher timeframes, like the 4-hour and daily charts, tend to offer more dependable reversal signals. Features such as the Smart Trail overlay and other Signal settings inside the Signals & Overlays indicator can provide confluence.
Pattern Detection Tools
The Reversal Candlestick Structure indicator detects sixteen bullish and bearish candlestick patterns and filters them with a stochastic-oscillator reversal algorithm to highlight high-probability turning points in real time. A built-in dashboard shows what percentage of detected patterns corresponded to actual reversals, letting you judge reliability at a glance. Key settings include “Trend Length” to focus on longer or shorter swings, “Threshold” to reduce false positives, and “Warmup Length” to avoid premature signals during sharp moves.
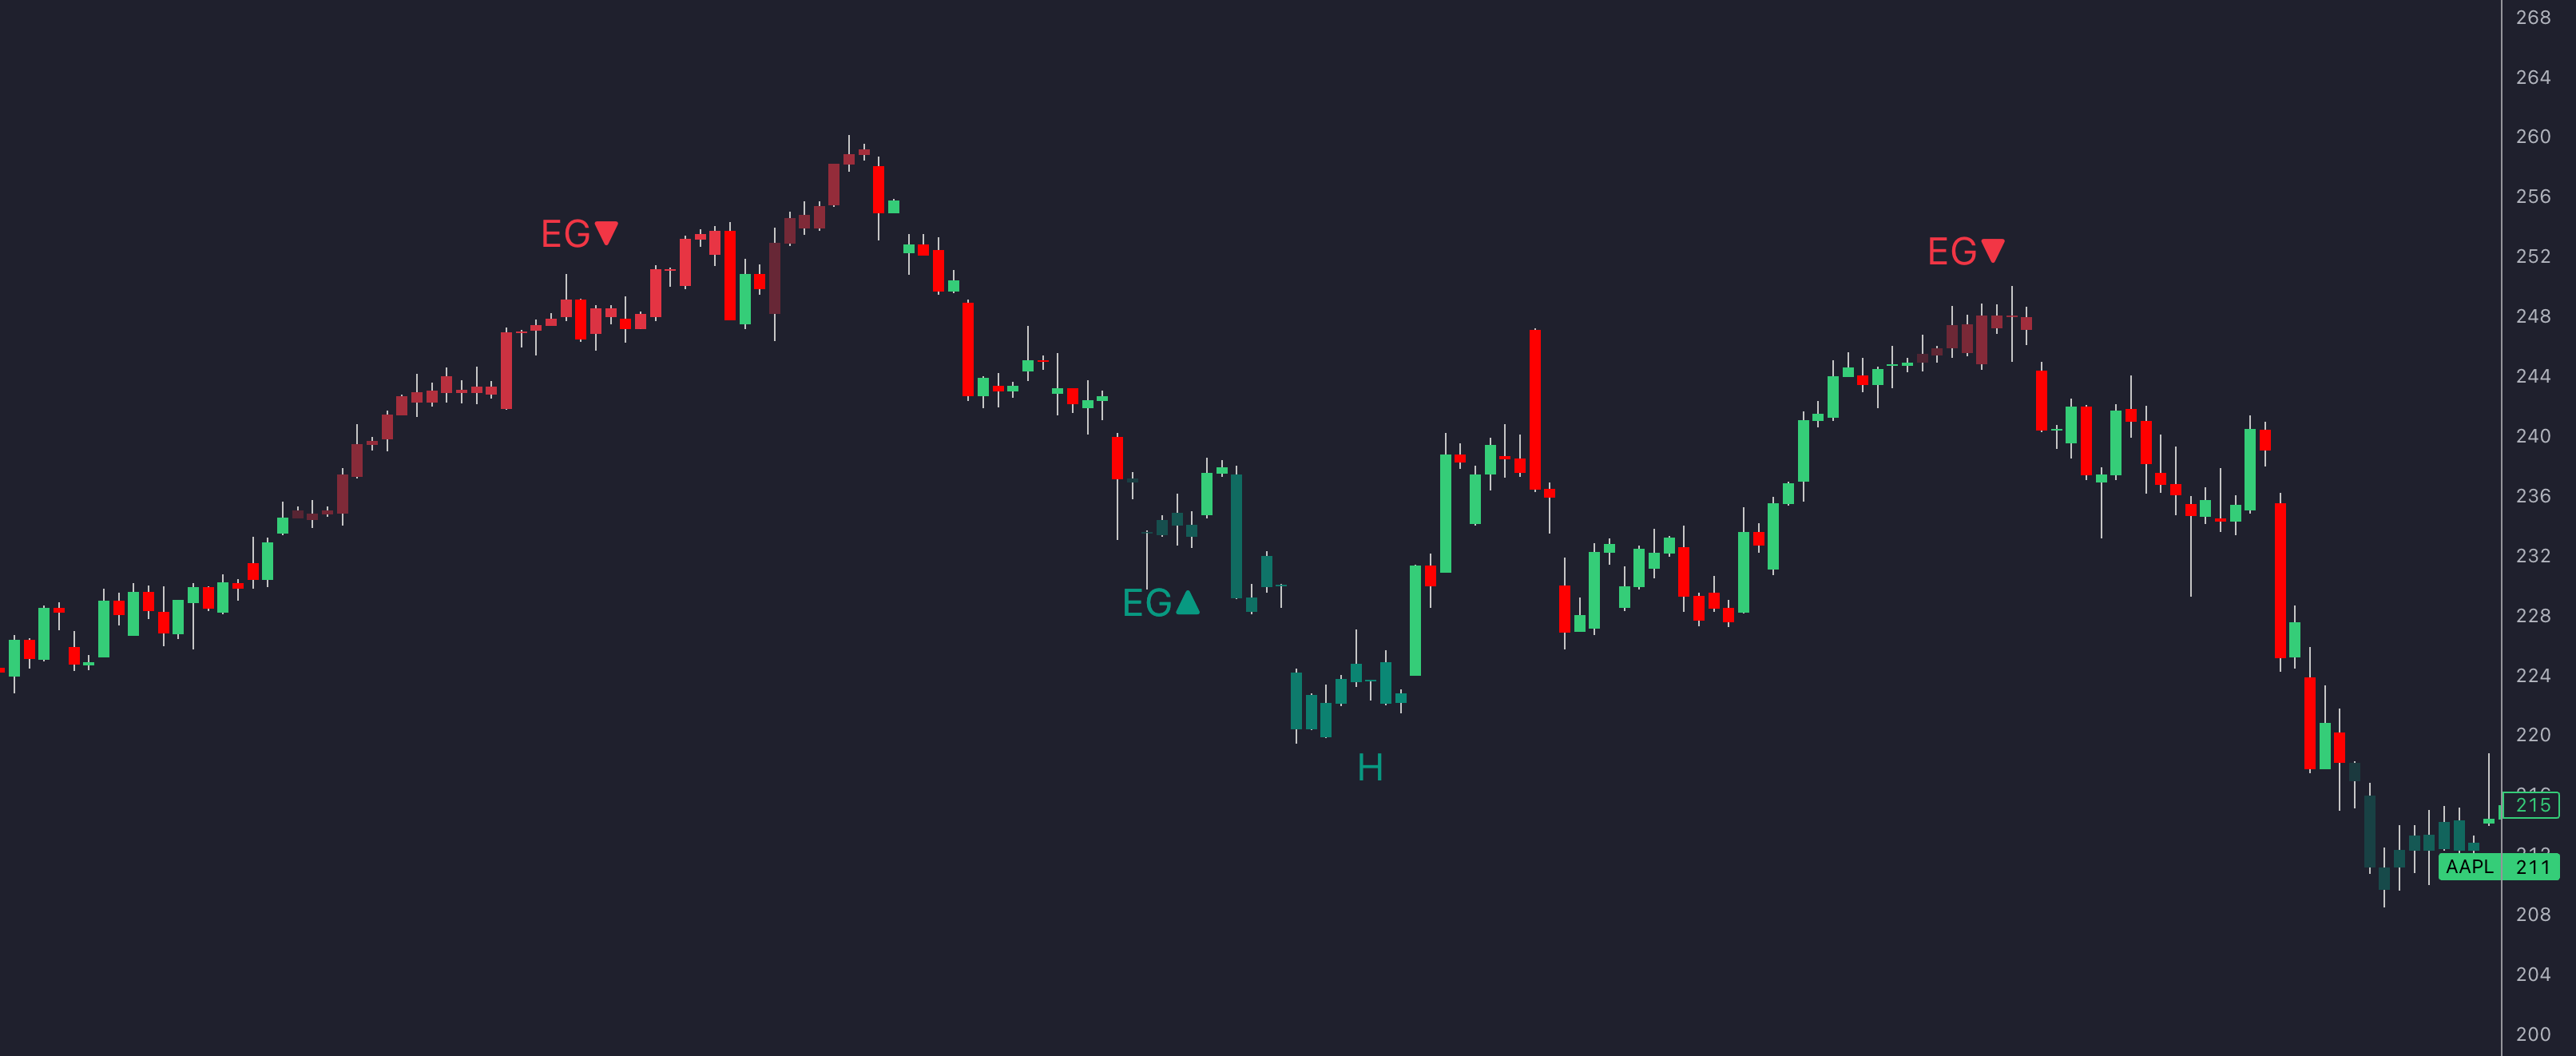
The indicator color-codes candles and labels patterns directly on the chart, making reversals easy to see without clutter. Because it works on TradingView, MetaTrader, NinjaTrader, and Thinkorswim, you can combine its signals with the Signals & Overlays or Oscillator Matrix indicators for additional confirmation.
Conclusion: Using Reversal Candles Effectively
Validating patterns and analyzing volume trends play a critical role in trading with reversal candles. By honing your ability to recognize these patterns and applying technical analysis, you can identify potential market turning points with greater confidence.
Take Tesla's July 2024 movement as an example. The stock broke past 750 USD, followed by pullbacks with lower volume, only to resume buying activity. This created profitable entry opportunities when analyzed alongside volume trends.
Here are three essential components that contribute to the success of reversal patterns:
| Component | How to Apply | What to Focus On |
|---|---|---|
| Pattern Validation | Use multiple timeframes | Daily and 4-hour charts for reliable signals |
| Volume Confirmation | Track price-volume relationship | Look for volume spikes, ideally 3x the average |
| Technical Integration | Pair with other indicators | Use RSI and moving averages for added confirmation |
These elements, when combined with the strategies discussed earlier, can significantly improve trading accuracy.
Best Practices for Using Reversal Patterns
Start by mastering simpler setups such as Doji and Engulfing patterns. For instance, in March 2024, the SPY ETF showed an inverted hammer at the 380 level. Strong volume confirmed the reversal, making it a textbook example of effective pattern recognition.
To maximize success:
- Confirm patterns on higher timeframes for reliability.
- Validate reversals with volume spikes near key support or resistance areas.
- Consider overall market conditions before executing trades.
Finally, understanding the difference between reversals and retracements is essential for improving both timing and trade accuracy.
FAQs
How can I combine reversal candles with other technical indicators to improve my trading strategy?
Combine reversal candles with tools such as volume analysis, Ultimate RSI, and Adaptive MACD. Validate signals on higher timeframes, then refine entries on lower timeframes.
What are the most common mistakes traders make when using reversal candle patterns?
Traders often overanalyze every candlestick instead of focusing on patterns near significant support or resistance, act without waiting for confirmation, and ignore the broader market context.
How does trading volume affect the reliability of reversal candle patterns, and how can I use it to make better trading decisions?
High volume during a reversal pattern suggests stronger conviction. Look for above-average volume on patterns such as Bearish Engulfing or Shooting Star. Combine this with confirmations from indicators like RSI or MACD for improved decision making.
References
- Candlestick Structure Indicator
- Reversal Candlestick Structure Indicator
- Hammer Pattern Article
- Shooting Star Article
- Swing Highs & Lows Indicator
- Oscillator Matrix Indicator
- Oscillator Matrix Documentation
- Signals & Overlays Indicator
- Smart Trail Overlay Guide
- Signals & Overlays Settings
- Ultimate RSI Indicator
- Adaptive MACD Indicator
- Price Action Concepts Indicator
- Market Structure Trailing Stop
- Statistical Trailing Stop
- FVG Trailing Stop
- Moving Averages Guide
- Liquidity Zones Guide
- AI Backtesting Assistant
- HyperWave Feature Guide


