Stop Loss Indicators: Essential Risk Controls
Stop loss indicators help define and visualize exit levels; they do not, by themselves, close positions at a broker. A plotted line, a strategy’s simulated exit, an alert, and a live stop order are different parts of a trading workflow. Understanding that distinction is the first step toward using these tools effectively.
LuxAlgo’s native charts and Quant support researching exit rules: describe the logic, review the generated code, and test it on the intended symbol and timeframe. Use the results to evaluate a rule’s behavior before deciding how to implement it in your execution setup.
What Stop Loss Indicators Do
An indicator can calculate a reference level from price, volatility, or market structure. You still need an explicit rule for acting on it: an intrabar touch, a completed close beyond the line, or another observable condition. An alert communicates a condition; order execution requires a separately configured execution process.
A broker stop order becomes a market order when triggered. The fill may differ from the stop price, particularly around gaps or thin liquidity. A stop-limit order restricts execution price but may remain unfilled. A trailing order moves its trigger as price moves favorably. Broker availability and trigger conventions vary; the SEC’s order bulletin explains these differences. None of these mechanisms guarantees a maximum loss or a particular profit.
3 Main Stop Loss Methods
| Method | Reference | Question to test |
|---|---|---|
| Percentage price stop | A defined percentage from entry | Does the distance fit this instrument and timeframe? |
| ATR-based stop | A multiple of recent true-range volatility | Which period, multiplier, and update rule are used? |
| Trailing stop | A distance behind a favorable price extreme or other reference | How much giveback does the rule allow, and can it loosen? |
Percentage Stop Losses
A price-percentage stop differs from an account-risk percentage. Buying at $100 with a stop 2% below entry places the stop at $98. The planned loss is $2 per share before costs. Whether that represents 0.5%, 1%, or another fraction of the account depends on quantity and account equity.
For a hypothetical $10,000 account with a $100 planned risk allowance, that $2 distance permits 50 shares before costs. A $4 distance permits 25 shares under the same allowance. Choose a defensible invalidation level, then calculate quantity; forcing the stop closer just to maintain a larger position changes the trade’s behavior.
For USD-quoted GBP/USD, 10,000 units have a pip value of $1 when one pip is 0.0001. A $500 account with a hypothetical 2% allowance has only $10 of planned risk, allowing a 10-pip stop at that quantity before costs. This arithmetic does not establish that 10 pips is appropriate. Reducing quantity is an alternative when the strategy needs more room. See position sizing and exposure.
ATR Stop Losses
Average True Range measures volatility, not direction. True range is the largest of the current high minus low, the absolute high minus previous close, and the absolute low minus previous close. ATR smooths those values over a selected period; the timeframe and smoothing method matter.
For an initial stop using ATR at entry:
- Long: entry − ATR × multiplier.
- Short: entry + ATR × multiplier.
If entry is $100, ATR is $2, and the multiplier is 2, the initial long stop is $96 and the short stop is $104. These are hypothetical settings to test, not universal recommendations. With $100 of planned price risk, a $4-per-share distance permits 25 shares before costs.
Specify whether ATR is frozen at entry or recalculated. Recomputing entry minus a larger ATR can move a long stop farther away, increasing exposure. A trailing implementation needs its own update rule. The ATR stop-loss guide compares several approaches.
Trailing Stop Losses
In a hypothetical long trade entered at $100, a 10% trail starts at $90. If the tracked high reaches $120, the trigger rises to $108. It stays there as price falls rather than moving down with price. A fill at $108 would produce $8 per share before costs, but the trigger does not guarantee that fill.
A fixed-distance trail and an ATR trail can behave differently as volatility changes. For a long ATR trail that must never loosen, one possible rule is to use the higher of the prior stop and the newly calculated candidate. State the price reference and update timing, and check the corresponding logic separately for shorts.
ATR Stop-Loss Video
This tutorial from The Moving Average demonstrates an ATR-based stop concept. Its examples are educational; test the assumptions and settings on your intended market rather than treating one indicator as universally best.
Setting Up Stop Loss Rules
Choose Placement from the Trade Idea
Support, resistance, moving averages, or a volatility measure can provide context for invalidation. There is no universal rule that low-volatility markets need a 1–2% stop or high-volatility markets need 3–5%. Judge distance relative to the instrument, timeframe, recent behavior, and entry logic.
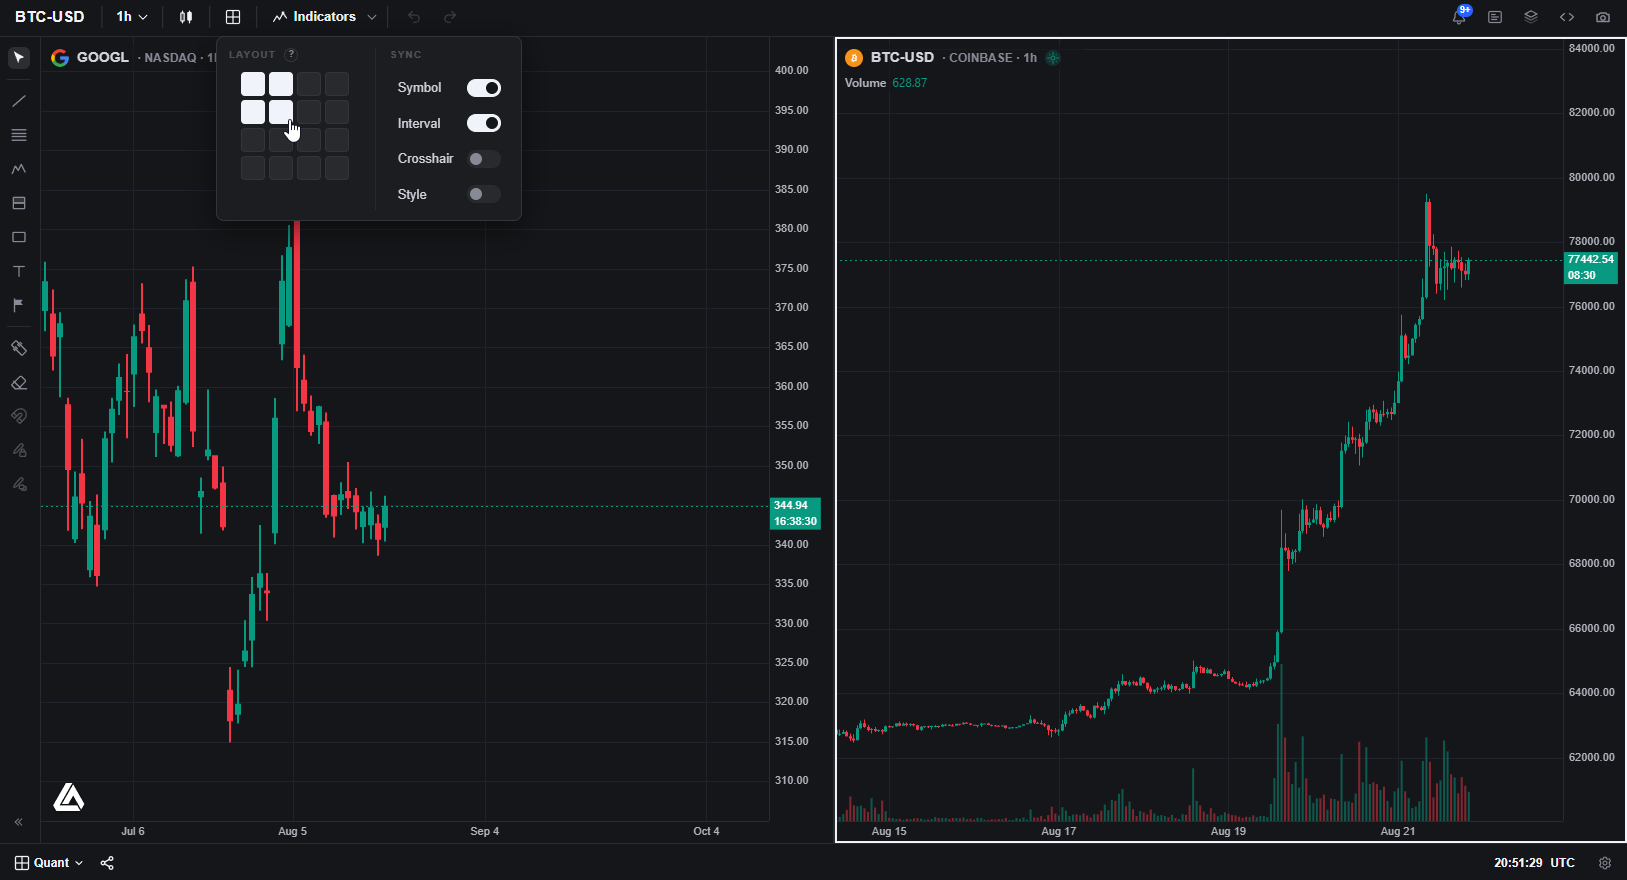
On LuxAlgo’s native charts, inspect the relevant levels and compare timeframes where useful. Record why the level matters before reviewing the outcome.
Use Multiple Indicators Only with Clear Rules
Combining indicators adds decisions; it does not automatically improve protection. If a price stop and a moving-average exit coexist, define which can close the trade first. If one is evaluated at the close and the other intrabar, preserve that difference in the simulation.
Chandelier Exit, Parabolic SAR, Bollinger Bands, and Donchian Channels offer different references. They are not interchangeable or guaranteed to suit a particular market regime. Likewise, the LuxAlgo Library’s Fibonacci Trailing Stop and Volume Delta Trailing Stop are indicator concepts to inspect and test, not broker-order services.
Stop Loss Mistakes to Avoid
- Confusing an indicator crossing with an executed order. Confirm how the live execution system handles the condition.
- Miscounting price distance. EUR/USD entry 1.2000 and stop 1.1900 are 100 pips apart. At 100,000 units, that is $1,000 of planned price risk before costs. An exit at 1.1950 is a different, 50-pip outcome; it does not demonstrate that the unchanged 1.1900 stop triggered there.
- Widening a stop without revisiting exposure. At unchanged quantity, a wider distance increases planned loss.
- Assuming a profitable exit is locked in. Execution uncertainty still applies after a trail rises above entry.
Fine-Tuning Stop Losses
Test the Complete Exit Logic with Quant
Tell Quant the entry condition, initial stop formula, trailing behavior, target or other exits, and sizing rule. Review Code before Run, checking when each value becomes available. Use standard price charts for fill analysis; synthetic Heikin Ashi prices do not represent executable market prices.
In strategy settings, use Inputs for exposed periods and multipliers and Properties for simulation settings such as order size, commission, and slippage. Compare a small predefined set of rules with consistent data and assumptions. Native Quant and the separate TradingView toolkit backtesters are distinct workflows.
Inspect individual stopped trades alongside net profit, win rate, loss size, and drawdown. Check bars that reach both a target and stop, gaps, and the timing of trailing updates. A high win rate alone does not validate the exit rule. Reserve unseen data for validation instead of repeatedly choosing the most flattering historical setting.
Adjust Through a Defined Process
If volatility changes, a predefined ATR rule may already respond. If you change the method itself, evaluate the revised rule before adopting it. Keep discretionary changes separate in your records so they do not become indistinguishable from the tested strategy.
Wider stops, tighter bands, and moving-average exits are hypotheses to compare. None ensures that a trade avoids a false exit or that an edge survives changing conditions.
Review Decisions as Well as Outcomes
Record the initial stop, planned monetary risk, actual fill, costs, and any change to the rule. Use LuxAlgo Journal to review trading records and notes. A losing trade that followed a tested rule differs from a loss caused by an unplanned increase in exposure; keep that distinction visible.
Putting It into Practice
Choose an exit concept, define its trigger and update timing, calculate quantity from the intended risk, and test it with realistic assumptions. Then confirm how that rule translates to your broker’s order behavior. Stop loss indicators make the plan easier to inspect; disciplined implementation and ongoing review determine how the plan is used.
Read next