

Explore the innovative Strat method for trading using candlestick patterns, focusing on price action for clear entry and exit strategies.
TheStrat is a trading method focusing on price action, not indicators. It uses three key candlestick patterns – Inside Bars, Directional Bars, and Outside Bars – to help traders identify trends, breakouts, and reversals. By analysing these patterns across multiple timeframes, traders can make clear entry and exit decisions. Here's a quick breakdown:
- Inside Bars – Price stays within the previous bar's range (signals consolidation).
- Directional Bars – Clear upward or downward price movement (confirms trends).
- Outside Bars – Price exceeds the previous bar's range (indicates reversals).
Why Use TheStrat?
- Simple Patterns – Focus on three main candlestick types. For a deeper dive, see Inside & Outside Bars by LuxAlgo.
- Multi-Timeframe Analysis – Aligns trends across hourly, daily, and weekly charts. If you’re new to the concept, this Candlestick Patterns How‑To provides helpful context.
- Defined Rules – Entry/exit strategies and risk management are straightforward. Review LuxAlgo’s TP/SL guide and risk‑reward overview for practical tips.
Key Patterns to Know
- 2-2 Pattern – Two consecutive candles breaking the previous high/low, signalling continuation or reversal.
- 3-1-2 Reversal – Outside bar → Inside bar → Directional break.
- 2-1-2 Reversal – Directional move → Inside bar → Continuation.
| Pattern Type | Entry Point | Exit Strategy |
|---|---|---|
| 2-2 Pattern | After second candle confirms | Prior support/resistance levels |
| 3-1-2 Reversal | Break of inside bar | Pattern’s extreme point |
| 2-1-2 Reversal | Inside bar breakout | Prior support/resistance levels |
Pro Tips for Success
- Risk Management – Limit risk to ~2% of capital per trade with stop-loss orders (what is a stop‑loss?).
- Volume Analysis – Use volume trends to validate patterns (see LuxAlgo’s volume confirmation guide).
- Testing First – Backtest patterns before live trading (intro to backtesting).
For advanced traders, LuxAlgo provides TradingView toolkits and real-time alerts that can streamline the trading process. Explore LuxAlgo to learn more, and try AI Backtesting to generate and evaluate rule‑based strategies.
Learn How I Swing Trade Using TheStrat (Masterclass)
Main Strat Pattern Types
Strat patterns help traders identify consolidation, breakouts, and opportunities in the market. Below, we break down the key types of patterns and their trading insights. For additional context, see LuxAlgo’s Inside Bar Breakouts and Inside & Outside Bars.
Inside Bar Patterns
An analysis of BTC/USDT on a 10-minute timeframe over 100 days found 1,916 inside bars. These trades showed a theoretical average profit of $27.67 per trade when trading 1 Bitcoin. This is an illustrative, historical sample—not a guarantee of future results. If you’re new to the concept, see what an inside day is.
Outside Bar Patterns
Outside bars signal shifts in market dynamics by engulfing the range of the previous candle. Their impact varies depending on the market’s overall direction (outside reversal explained):
| Pattern Type | Signal | Implication |
|---|---|---|
| Bullish Outside Bar | Strong buying pressure | Possible upward reversal |
| Bearish Outside Bar | Strong selling pressure | Possible downward reversal |
| Neutral Outside Bar | High volatility | Wait for confirmation |
Multi-Bar Pattern Sequences
Multi-bar patterns outline specific entry and exit strategies based on their structure:
- 2-2 Pattern – Two consecutive candles that break the previous high or low, followed by a similar two-candle sequence. This often signals a continuation or reversal.
- 3-1-2 Reversal Pattern – Begins with an outside bar (3), followed by an inside bar (1) indicating consolidation, and ends with a directional break (2). Traders typically enter on the break of the inside bar, placing stop-loss orders beyond the pattern’s extremes.
- 2-1-2 Reversal Pattern – Features a directional move (2), consolidation (1), and another directional move (2). The inside bar serves as a key reference for managing positions.
“As a beginning trader, it's easiest to learn how to trade inside bars in-line with the dominant daily-chart trend, or ‘in-line with the trend’.”
Trading with Strat Patterns
Trade Entry and Exit Rules
To trade effectively using Strat patterns, follow these guidelines:
- 2-2 Pattern – Enter in the direction of the second candle. For a bullish setup, take a long position once the second candle confirms the move.
- 3-1-2 Reversal Pattern – Use the inside bar as your reference. Enter when the price breaks above or below the inside bar, depending on the pattern’s direction.
| Pattern Type | Entry Point | Exit Strategy |
|---|---|---|
| 2-2 Pattern | After the second candle confirms | Prior support/resistance |
| 3-1-2 Reversal | Break of the inside bar | Pattern’s extreme point |
| 2-1-2 Reversal | Inside bar breakout | Prior support/resistance |
Once entry and exit rules are established, managing risk becomes the next critical step. Get a primer on stop‑order rules and ATR‑based stop‑loss methods.
Risk Control Methods
Effective risk management is essential for Strat trading success. Many experienced traders suggest limiting risk to no more than ~2% of total trading capital per trade (risk‑reward basics).
Set stop-loss orders based on the specific pattern:
- 2-2 Pattern – For short trades, place the stop above the pattern's highest point; for long trades, place it below the lowest point.
- 3-1-2 Pattern – Position stops beyond the pattern's extreme to account for normal market fluctuations.
- 2-1-2 Pattern – Set stops just outside the range of the inside bar, depending on your trade direction.
Testing Strat Trading Methods
Before applying Strat patterns in live markets, thorough testing is essential. Evaluate these patterns across different market conditions to ensure reliability. Start by analysing higher timeframes to identify patterns, then move to lower timeframes for precise entry points. For structured experimentation, consider LuxAlgo Backtesters and the AI Backtesting Assistant (what backtesting does).
You can also enhance your strategy by combining Strat patterns with other technical indicators for confirmation. When patterns align across multiple timeframes, they often produce stronger signals. The PAC market‑structure tools and PAC Backtester entry rules are helpful references.
A structured testing process includes:
- Pattern Identification – Record each pattern and its market context to understand its behaviour.
- Risk Assessment – Calculate the potential risk/reward ratio for each trade, aiming for at least a 1:2 ratio.
- Performance Analysis – Track key details like pattern type, entry/exit points, and the overall market environment.
“As a beginning trader, it's easiest to learn how to trade inside bars in-line with the dominant daily-chart trend, or ‘in-line with the trend’.”
Higher‑Level Strat Concepts
Price Range Analysis
Strat trading categorises market conditions into three types: expanding, contracting, or transitional. Expanding markets occur when price action creates both higher highs and lower lows compared with previous bars, signalling heightened volatility and potential breakout scenarios. Contracting markets show lower highs and higher lows, pointing to consolidation or reduced momentum. For a foundations refresher, review LuxAlgo’s essential candlestick patterns.
| Market Condition | Price Characteristics | Trading Implications |
|---|---|---|
| Expanding | Higher highs, lower lows | More volatility; potential breakouts |
| Contracting | Lower highs, higher lows | Slower momentum; possible consolidation |
| Transitional | Mixed price behaviour | Wait for clearer directional signals |
Recognising these patterns is key before layering in other trading techniques.
Timeframe Coordination
To trade Strat patterns effectively, aligning multiple timeframes is crucial. A useful guideline is to maintain a ratio of 4–6 between timeframes. For example, if you’re trading on a 1‑hour chart, also analyse the 4‑hour and daily charts. This approach provides a broader market perspective and helps confirm trends, making Strat patterns more reliable (testing alignment across TFs).
Volume and Strat Pattern Links
Volume analysis plays a key role in validating Strat candlestick patterns. For instance, when TSLA broke above $750 on high volume, it confirmed a strong move. Later, as volume tapered, the momentum slowed. Similarly, SPY’s inverted hammer pattern was paired with large red volume candlesticks, reinforcing the signal. See also volume confirmation for trends.
Key volume‑pattern relationships to watch include:
- Rising prices with increasing volume – indicates strong uptrends.
- Falling prices with rising volume – suggests solid downtrends.
- Declining volume during price increases – may point to weakening trends.
Strat Analysis Software Tools
Advanced software can take Strat methods to the next level, making the analysis process smoother and more efficient. Traders need reliable options for Strat analysis, and LuxAlgo provides comprehensive TradingView toolkits along with an AI Backtesting platform for in‑depth pattern work.
LuxAlgo TradingView Toolkits Overview
LuxAlgo provides a Price Action Concepts (PAC) toolkit packed with features such as automated pattern detection, market‑structure analysis, and volume integration to confirm signals. This combination allows traders to spot Strat setups faster and simplify their market evaluations.
Setting Up LuxAlgo Automation
LuxAlgo’s automation and alert features make detecting Strat patterns easier. Plans:
- Free – $0, lifetime access. Includes hundreds of tools across 5+ platforms.
- Premium – $39.99/month – advanced signals, alerts, oscillator tools on TradingView.
- Ultimate – $59.99/month – includes access to the AI Backtesting Assistant.
To get the most out of these features:
- Adjust pattern‑recognition settings
- Set up custom alerts and real‑time notifications
- Leverage volume analysis for stronger confirmation (see volume techniques)
LuxAlgo “TheStrat” Indicator (Free Library Tool)
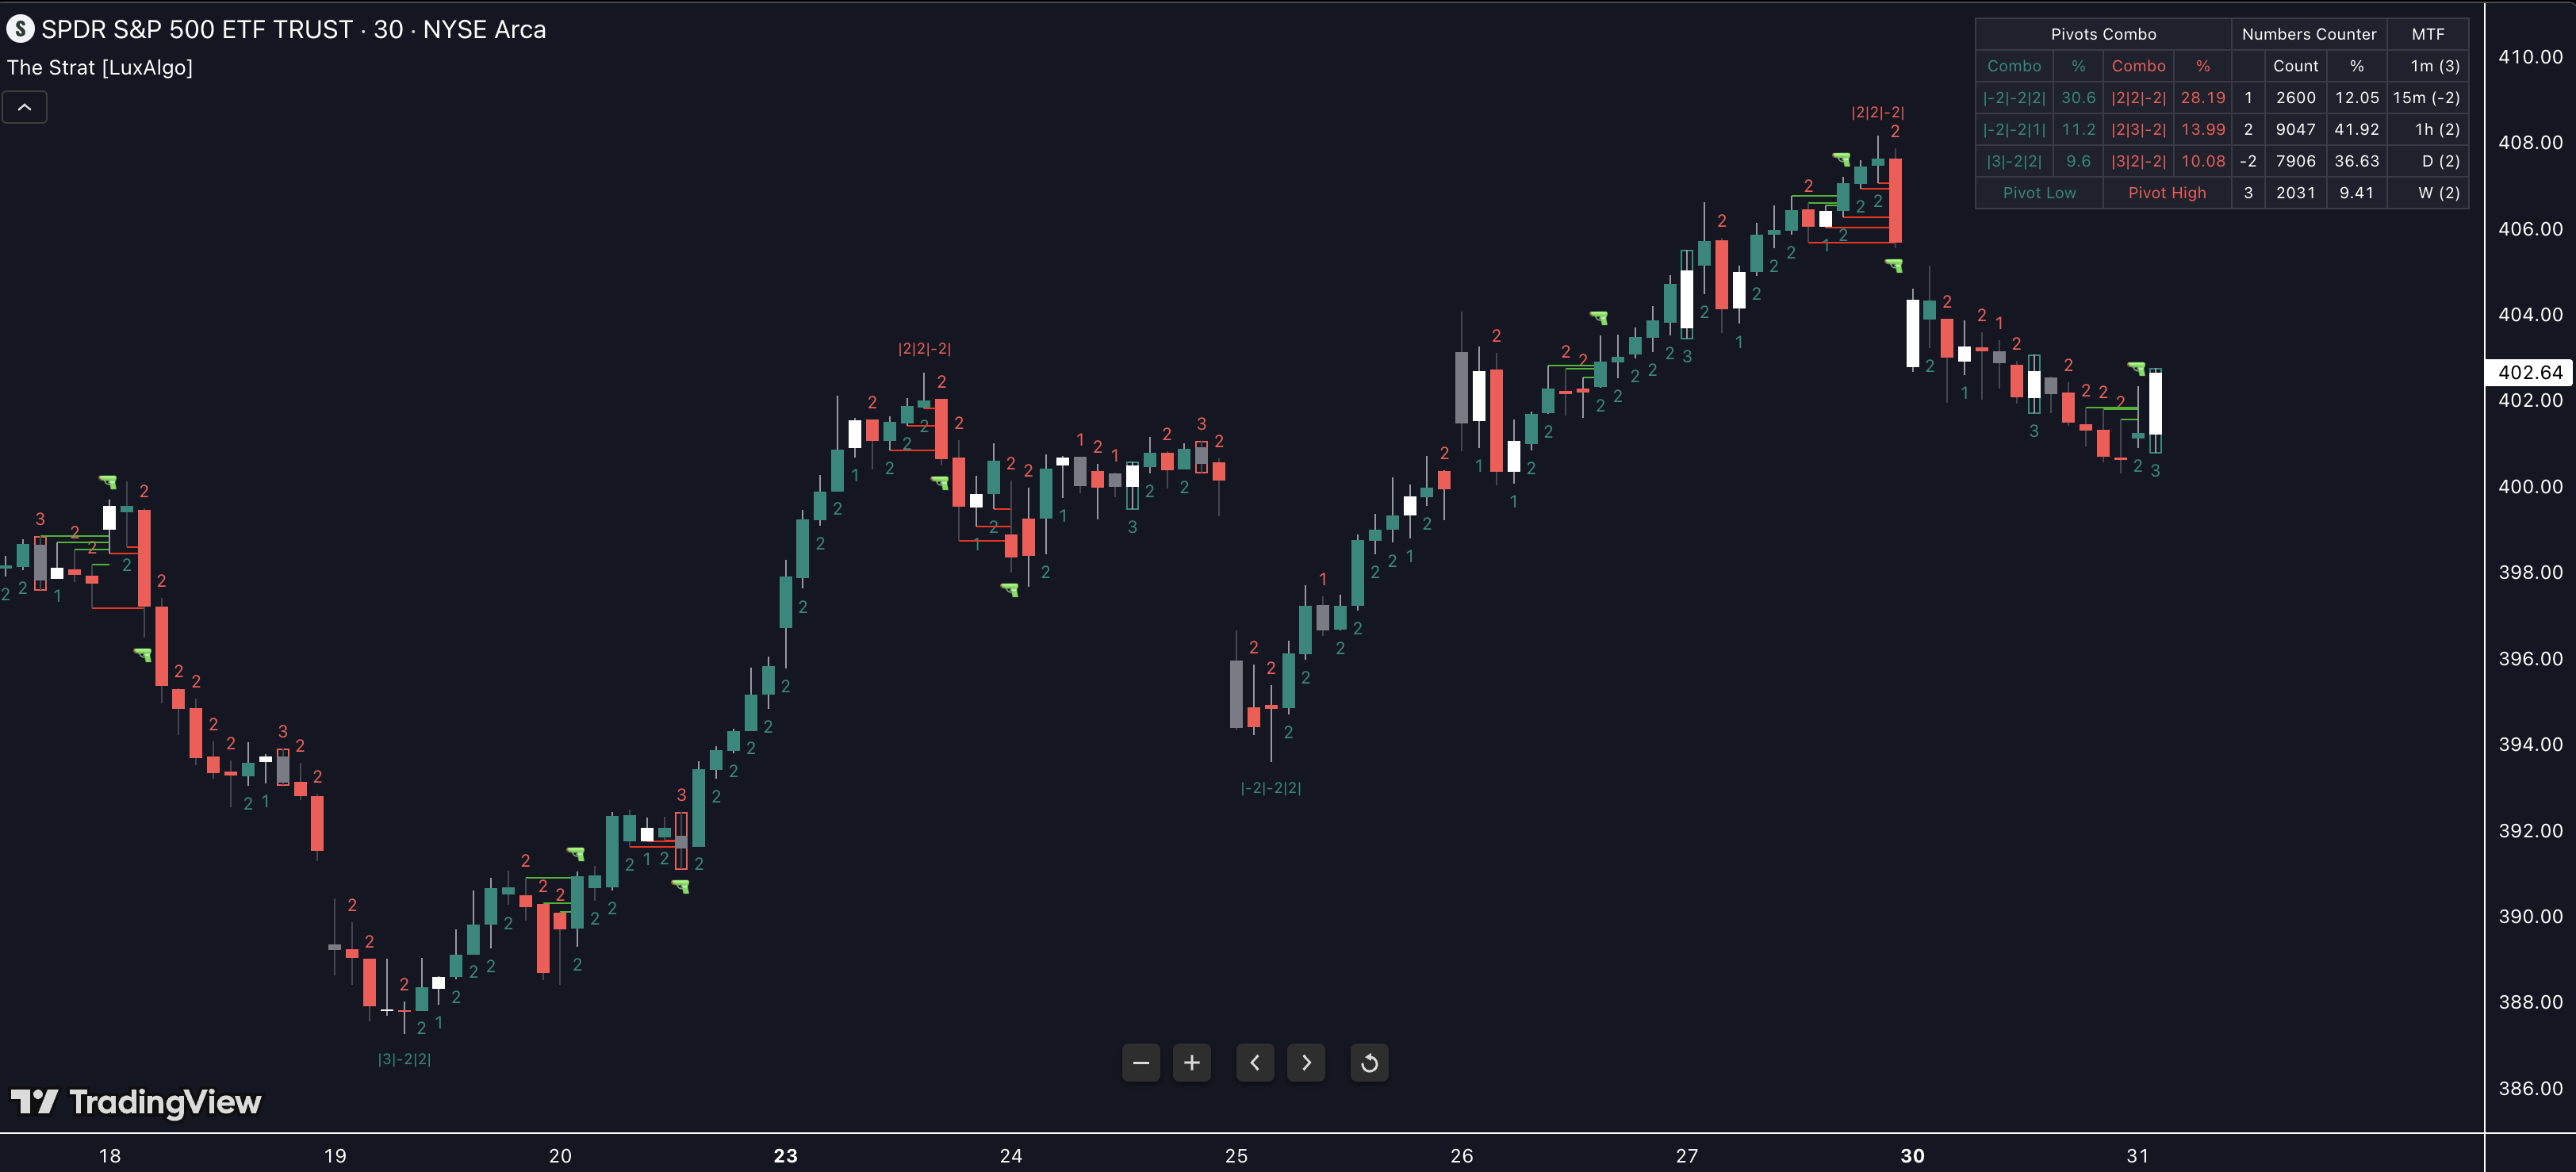
The LuxAlgo “TheStrat” indicator is a free, open‑source overlay available via TradingView. It packages most concepts from TheStrat methodology into a single, easy‑to‑use view. You can also read the Library overview on luxalgo.com.
- Candle Numbering – shows each bar’s “1”, “2”, or “3” value directly on the chart.
- Pivot Machine Gun (PMG) Highlighter – spots PMG setups at a glance.
- Custom Combo Highlighter – automatically flags popular combo patterns like 2‑1‑2 or 3‑1‑2.
- Statistics Dashboard – visual panel summarising pattern counts and context.
- Flexible Alerts – fire notifications for specific candle numbers, custom combos, or PMGs.
Because it’s free to add on TradingView, any user can try it, pair it with the PAC toolkit for market‑structure context, and explore LuxAlgo’s Premium and Ultimate plans when ready.
LuxAlgo Trading Network
LuxAlgo nurtures an active trading community where members share insights and learn collaboratively. The network includes:
- 24/7 live support
- Strategy forums for discussion
- Weekly scanner results (available with the Ultimate plan)
- Community‑tested strategies
“Trading patterns is one of the most sophisticated trading strategies. It exploits the psychology of market participants and takes advantage of market insights.” – Tickeron
Summary
The Strat method offers a streamlined way to approach technical analysis by breaking down price action into three main patterns. This makes it easier for traders to interpret market behaviour and act with confidence.
Main Points Review
Pattern Recognition Basics
The Strat method zeroes in on raw price action using a set of defined patterns. These patterns form the foundation for analysing timeframes and managing risks. See our primer on 12 candlestick types.
Multi‑Timeframe Analysis
Checking signals across different timeframes is a key part of Strat trading. When patterns align across multiple timeframes – especially when two higher timeframes confirm the current one – the chances of a successful trade improve significantly. This adds structure and precision to market analysis.
Implementation Steps
Here’s how to put the Strat method into practice:
- Spot patterns across timeframes (use PAC market‑structure)
- Assess overall market conditions
- Set well‑placed stop‑losses (TP/SL guide)
- Confirm signals using volume (volume techniques)
These steps build on earlier strategies, combining them with modern features for better execution. Automation features, for example, help refine pattern detection and trading decisions while staying true to the method’s core principles.
Key Components Overview
| Strat Component | Benefit | How It’s Used |
|---|---|---|
| Raw Price Action | Provides clarity | Focuses on analysis without extra indicators |
| Timeframe Continuity | Improves precision | Verifies signals across timeframes |
| Pattern Structure | Ensures consistency | Identifies reliable trading setups |
| Risk Management | Protects capital | Uses strategic stop‑loss placement |
References
LuxAlgo Resources (15)
- LuxAlgo – TradingView Toolkits & AI Backtesting
- AI Backtesting Assistant
- Reversal Spotting Made Easy – Blog
- Inside Bar Breakouts – Blog
- Inside & Outside Bars – Blog
- Candlestick Patterns: How‑To – Blog
- Stop‑Loss & Take‑Profit – Blog
- Risk‑Reward Ratios – Blog
- Volume Analysis Techniques – Blog
- Using Volume to Confirm Trends – Blog
- Essential Candlestick Patterns – Blog
- Twelve Candlestick Types – Blog
- 5 ATR Stop‑Loss Strategies – Blog
- PAC Market‑Structure – Docs
- PAC Backtester Entry Rules – Docs


