Using Volume to Confirm Trends: Best Trading Strategies
Volume can add context to a trend, but no volume strategy is best for every market. The useful question is whether a defined volume condition improves a price-based trading rule after costs. Start with comparable data, clear entries and exits, and a separate validation period.
LuxAlgo’s native charts provide a workspace for price-and-volume analysis. Use Quant to turn an idea into a strategy you can inspect and test, while keeping the role of each indicator explicit.
Price and Volume Relationships
Volume usually records traded quantity, not the number or identity of participants. Check the venue, units, session, and whether the feed reports traded volume or tick activity. Green and red volume bars often follow a price-direction rule rather than actual aggressive buying and selling.
| Pattern | Observation | Interpretation to test |
|---|---|---|
| Possible accumulation | Price stabilizes or advances while activity changes | Whether the range eventually resolves upward; volume alone does not identify accumulation |
| Possible distribution | Price stalls or weakens amid substantial activity | Whether support fails; participant motives remain unknown |
| Possible climax | An extended move ends in unusually high activity | Exhaustion versus continuation requires further price evidence |
| Volume dry-up | Activity falls against a defined baseline | A quiet consolidation, weak move, session effect, or data issue may explain it |
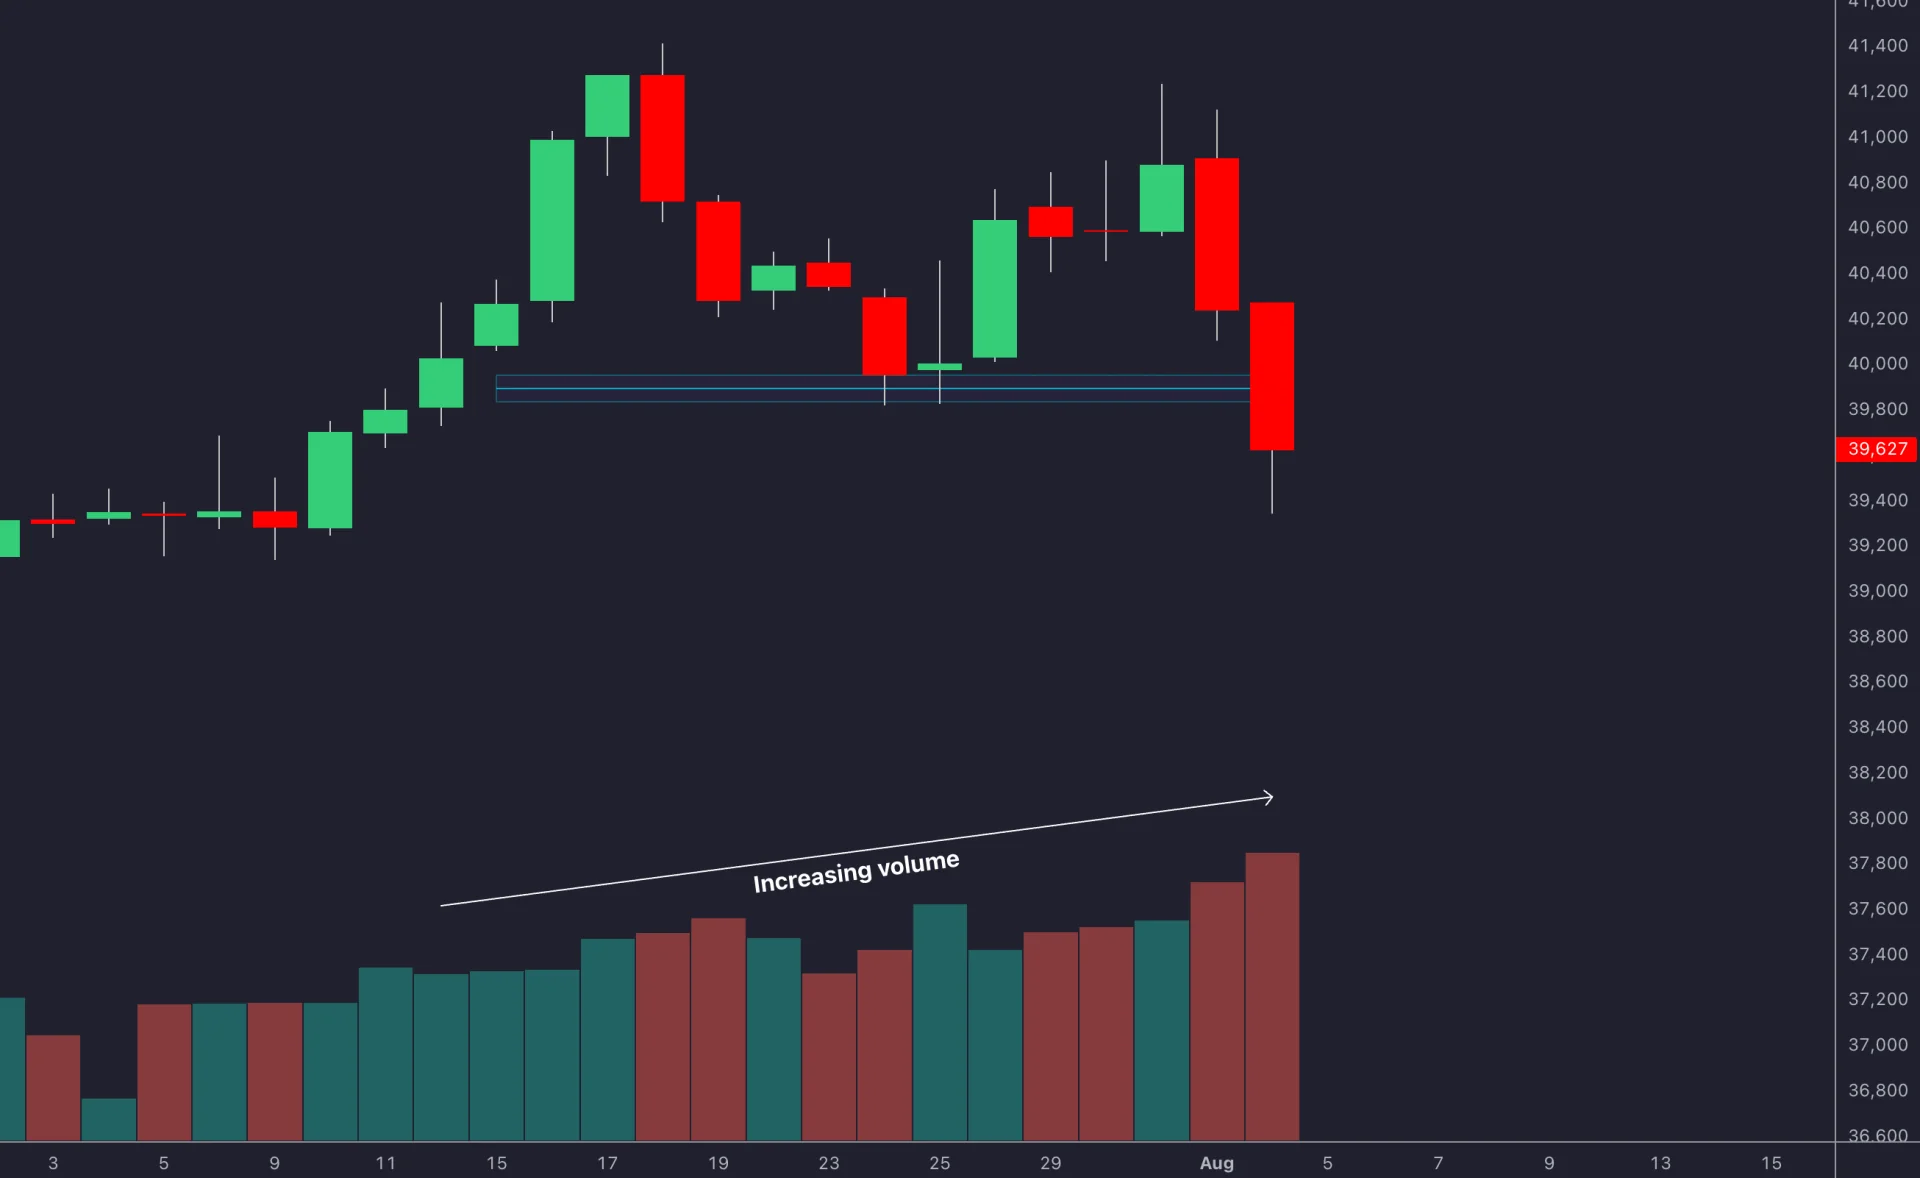
Increasing activity on advances and lighter activity on pullbacks can support a trend interpretation. Declining activity at new highs or a spike against the trend can prompt closer review. Neither pattern supplies a fixed success rate or tells you precisely when to exit.
Four Volume Indicators and Their Calculations
On-Balance Volume
OBV adds the current bar’s volume when its close exceeds the previous close, subtracts it when the close is lower, and is unchanged when the closes match. It classifies the entire bar by that price change. Its swings can be compared with price, but it does not measure actual net institutional transactions.
Accumulation/Distribution Line
The A/D Line accumulates volume weighted by the close’s location within each bar: multiplier = ((close − low) − (high − close)) ÷ (high − low). Add multiplier × volume to the previous A/D value. Check how the implementation handles a zero high-low range.
Unlike OBV, this multiplier does not compare the close with the prior close. A gap-down bar that finishes near its own high can therefore contribute positively. A/D is a price-volume proxy, not direct evidence of cash entering an asset or a count of institutional buyers.
Volume Rate of Change
VROC = 100 × (current volume − volume n bars ago) ÷ volume n bars ago. It compares two observations, rather than current volume with an average. A zero comparison value makes the percentage undefined; a very small value can produce a large reading.
For example, 150,000 shares compared with 100,000 shares n bars earlier produces +50% VROC. Whether that is unusual depends on the chosen bars and session. It does not predict a 50% price move.
Volume-Weighted Moving Average
A VWMA divides the rolling sum of price × volume by the rolling sum of volume. Higher-volume bars receive greater weight. Specify the price source and lookback, and handle an empty or zero-volume window explicitly.
VWMA uses a rolling window. An anchored VWAP instead accumulates from a chosen reset point. Comparing a VWMA with a same-length simple average shows the effect of volume weighting, not independent evidence that a trend must continue.
Three Strategies to Define and Test
1. A Price Breakout with a Volume Filter
Mark a range using prior bars, require your chosen price trigger, and add a relative-volume condition. A 1.5-times-average threshold is an example to test, not a universal breakout definition. Compare equivalent sessions and avoid using a completed day’s final volume for an earlier intraday entry.
Suppose a hypothetical stock closes above $120 resistance while volume reaches 1.5 million shares against an average of 1 million. Activity is 50% above average. This qualifies only if it matches a rule chosen before the signal; it does not imply a particular subsequent rally.
If the actual modeled entry is $121 and the planned stop is $118, price risk is $3 per share. A $300 risk budget with $0.15 per share allowed for estimated costs and adverse execution permits floor($300 ÷ $3.15) = 95 shares, or $299.25 planned risk. A $127 target offers 2:1 reward to price risk before costs. Gaps or worse fills can exceed planned risk.
2. Price-Indicator Divergence
Define the indicator and corresponding swings first. These conventional divergence descriptions apply to an oscillator or indicator series; “above-average volume on a pullback” alone is not a hidden-divergence definition.
| Divergence | Price | Indicator |
|---|---|---|
| Regular bullish | Lower low | Higher low |
| Regular bearish | Higher high | Lower high |
| Hidden bullish | Higher low | Lower low |
| Hidden bearish | Lower high | Higher high |
Divergence can persist while a trend continues. Define the later price trigger and exit instead of entering solely because two lines disagree. Swing-detection rules can require later bars for confirmation; a backtest must respect that delay.
3. Trend Pullbacks with Relative Activity
Choose an explicit trend rule, then compare activity on advances and pullbacks. For example, test whether a pullback entry performs differently when its completed-bar volume is below a chosen average. Keep the entry, stop, and target identical when comparing the filtered and unfiltered versions.
This is a testable participation condition, not proof of accumulation or institutional involvement. See using volume for trend confirmation for data and timing considerations.
Combine Volume with Channels, Chart Patterns, and RSI
Volume-Weighted Channels
There is no single formula for every volume-weighted channel. Specify the center line, rolling or anchored window, dispersion calculation, and band multiplier. A lower-band rebound and an upper-band breakout are different strategies and need different entry and exit rules.
Do not assume a channel break means reversal or that adding volume improves accuracy by a fixed percentage. Test whether the extra calculation helps compared with a simpler moving-average or price-range rule.
Head and Shoulders
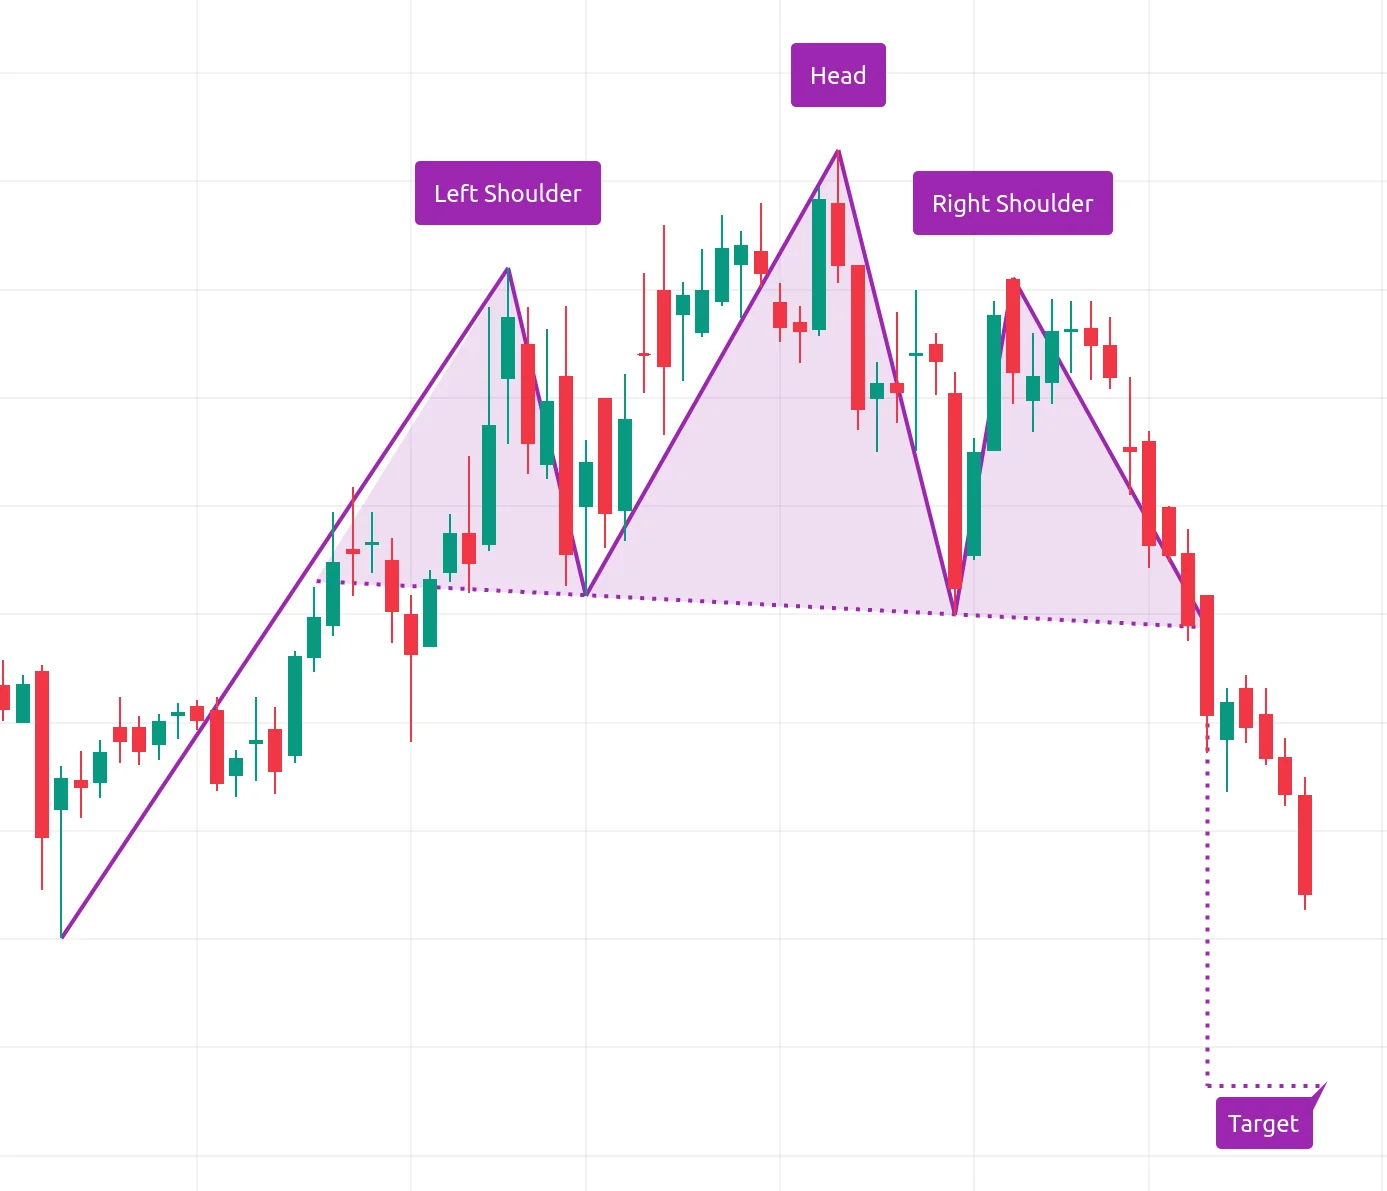
A head-and-shoulders top has a higher central peak between two lower shoulders. The neckline connects the intervening lows; a chosen break or close below it can define completion. Volume may provide context around the shoulders and neckline, but does not establish a universal pattern success rate.
RSI and Volume-Weighted RSI
RSI describes price momentum. Indicators called volume-weighted RSI can use different calculations, so inspect the implementation before comparing it with standard RSI. Both being below 30 is not automatically a buy signal, and both being above 70 is not automatically a sell signal. Strong trends can sustain extreme readings.
Define any crossing, divergence, or recovery condition precisely. Adding related indicators can increase complexity without adding independent information.
Use Volume Profile for Price-Level Context
A profile groups volume into price bins. The Point of Control is the highest-volume bin; high- and low-volume nodes describe relatively busy and quiet regions. A value area uses a selected percentage of historical activity, commonly 70%, rather than a probability that future price will remain there.

LuxAlgo’s native profiles include candle-based Visible Range and footprint-based Session and Rolling profiles. Visible Range changes with the displayed chart range; its candle-direction coloring is not aggressor-side volume. Fixed-range analysis and session analysis are not inherently restricted to long-term and short-term trading respectively.
Use a profile level to define a hypothesis, then specify what price must do at it. A busy node can attract activity or be crossed; it is not guaranteed support. Confirm that the data needed for a custom profile strategy is available before assuming the chart display can be reproduced in a backtest.
Native Quant Strategies
Use Quant to build the explicit indicator and strategy logic, review the generated code, and inspect native strategy properties and results. Include commission and slippage, examine individual trades, and compare drawdown and net returns alongside win rate. Reserve later data for validation and test nearby settings.
Video: Volume Analysis Examples
This retained Mind Math Money tutorial provides additional volume-analysis examples. Its demonstrations are educational illustrations, not evidence for a fixed success rate.
How to Effectively Use Volume in Trading?
Start with reliable, comparable data and a clear price-based setup. Define the volume calculation, signal timing, and risk rules, then compare the strategy with and without the volume condition. Indicators and profiles can add context, but high volume does not guarantee a valid breakout, reversal, or profitable trade.
References
Read next