52 Week High/Low
 By LuxAlgoApr 13, 2020
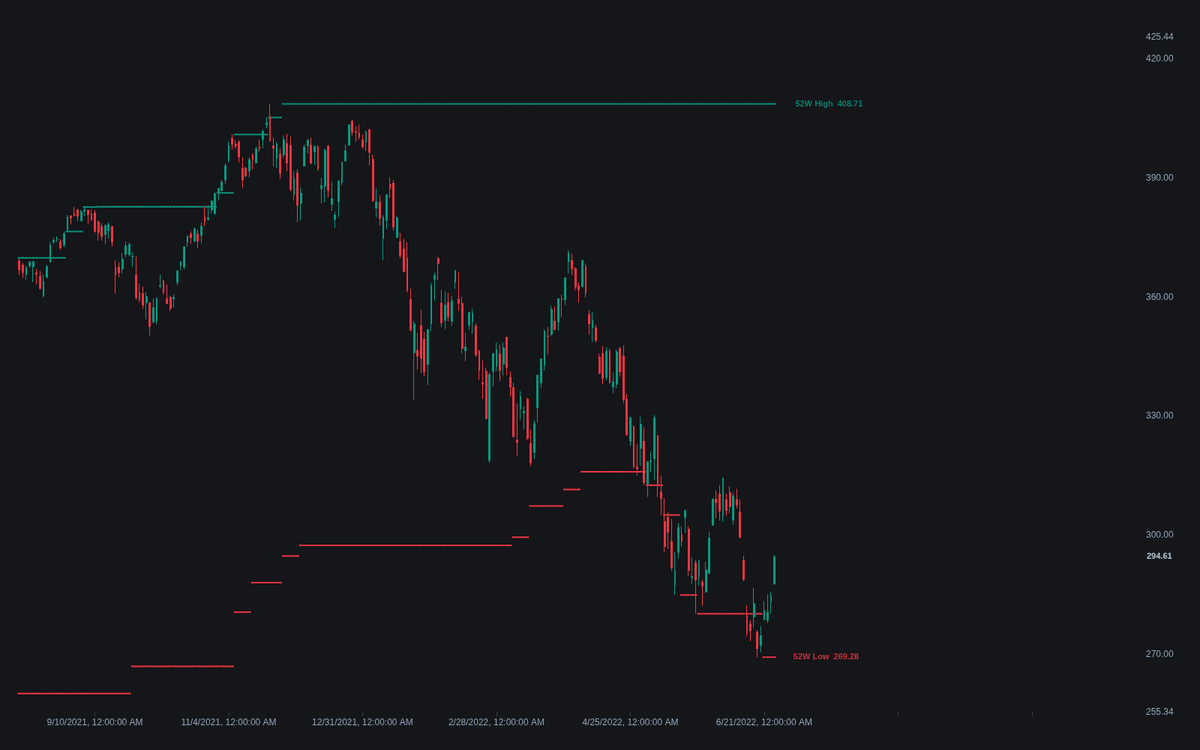

The 52 Week High/Low plots horizontal levels at the highest high and lowest low of the trailing 52 weeks, keeping a yearly reference frame on the price chart. The lines update as new extremes print or as old ones expire from the rolling window, and an optional toggle adds the all-time high and low. Because the levels are requested from weekly data, they read the same on any chart timeframe, and the build keeps them deliberately plain: nothing is filtered or projected beyond the natural roll of the window.
How to Trade the 52 Week High/Low?
- First test of the 52 Week High: a level that capped price for a full year rarely gives way on the first attempt. Look for rejection wicks or a stall before assuming continuation.
- Close above the 52 Week High: trailing-year strength; breakout traders watch for the broken level to hold as support on a retest.
- Close below the 52 Week Low: the mirror read, with the broken low acting as resistance if price recovers to it.
- Level steps without new trade: the 52 Week High line can step down simply because an old peak expired from the rolling window. An aging extreme, not fresh selling pressure.
- All-Time High breaks: with the toggle enabled, a push beyond the record leaves no layer of sellers above, so discovery there often behaves unlike an ordinary breakout.
Two alert conditions ship with the build, New 52 Week High and New 52 Week Low, firing when the close crosses the prior bar's level.
52 Week High/Low Settings
- Show All-Time High/Low (default disabled): adds the All-Time High and All-Time Low over the symbol's full available history, useful for separating yearly highs from genuine record territory.
Beyond that toggle the indicator is parameter-free: the 52-week window is fixed by definition, and the remaining inputs only set the colors of the plotted levels.
Frequently Asked Questions

The Library is free. Quant makes it yours.
Pull any concept or indicator into Quant: rebuild it, retune it, or turn it into a backtested strategy of your own.