Concept
All-time & 52-week Extremes
All-time & 52-week Extremes, also known as ATH/ATL, 52-week high/low, are Support/Resistance & Levels concepts. The Library holds 3 implementations, each one a working definition you can pull into Quant.
Top All-time & 52-week Extremes indicators
The top custom implementations, built on the original standard All-time & 52-week Extremes formula.
3 total
Want to trade All-time & 52-week Extremes? Any of the 3 implementations below is one prompt away from a backtested strategy in Quant.
The standard All-time & 52-week Extremes indicator
All-time & 52-week Extremes exactly as classically defined: the faithful reference build of the original formula, free to run in Quant.
What are All-time & 52-week Extremes?
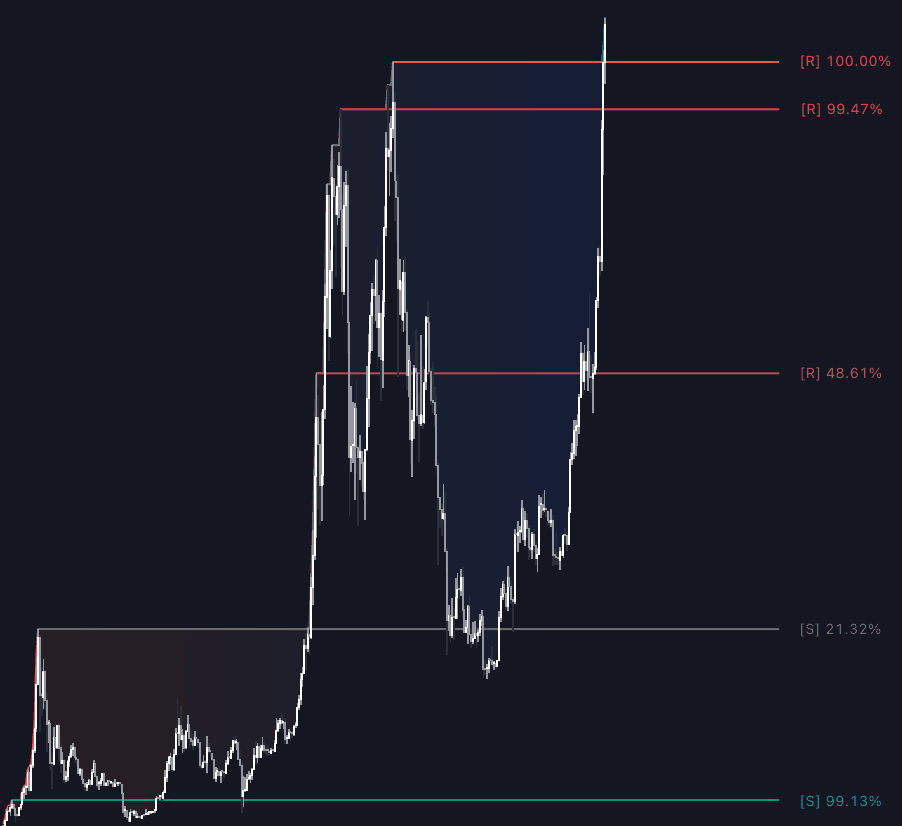
All-time and 52-week extremes are the outer edges of an instrument's price history: the all-time high (ATH) and all-time low are the most extreme prices ever traded, and the 52-week high and low are the extremes of the trailing year. They are the longest-lookback members of the reference-level family that includes prior period levels, and the ATH carries weight for a structural reason: above it there is no overhead supply. Every holder is in profit, no trapped buyers are waiting to sell at breakeven, and price trades in open discovery.
The 52-week convention is a newspaper inheritance: stock tables printed each name's trailing-year high and low for decades, and the figures still headline screeners, which keeps them self-reinforcing reference points. The behavior around them has been studied formally: George and Hwang's 2004 study found stocks near their 52-week high tended to keep outperforming, which they attributed to anchoring on the salient reference. Later research finds the effect varies by market and era, so treat it as a documented tendency rather than a rule.
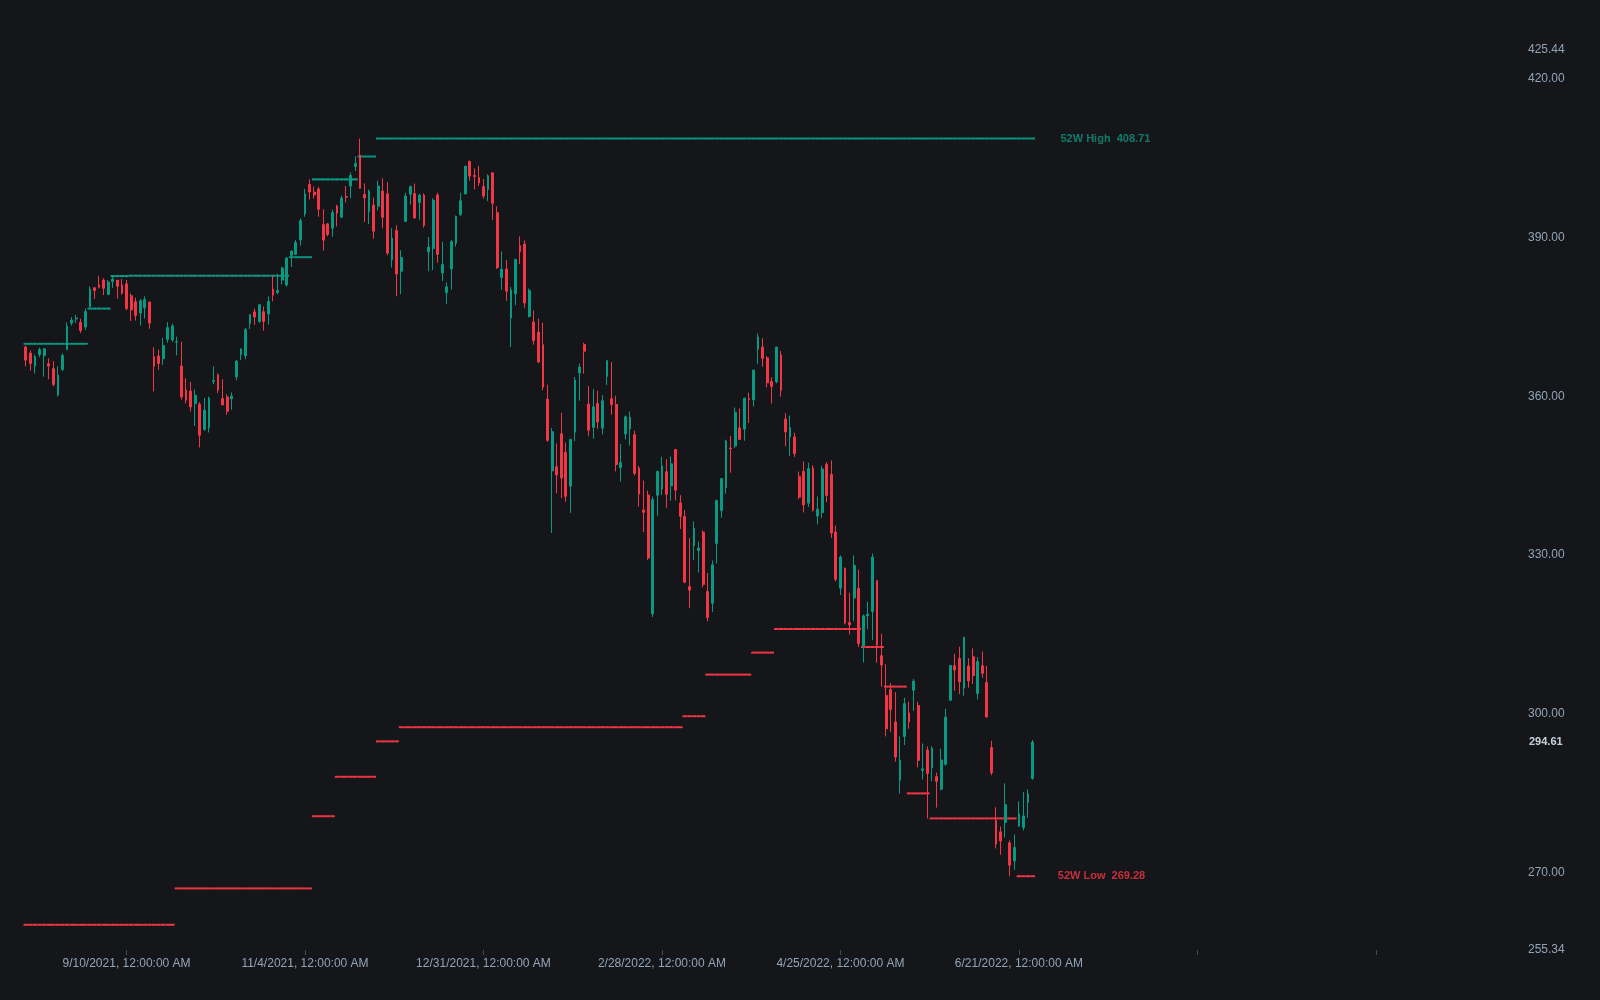
Computation is simple, but conventions matter. The ATH is the running maximum of the entire series and can only ratchet upward, while the 52-week high is a rolling maximum over roughly 252 trading days, so it can drift lower as old peaks age out of the window. Wick-based and close-based extremes sit at different prices, and adjusted data can move historical extremes, so know which print your platform calls the high.
In use these levels behave like any resistance level or support level, only with maximal lookback and visibility: first tests often stall, clean breaks get retested, failed breaks trap late entrants, and a rejected test of a prior ATH can start a deep retracement. They also carry a breadth dimension, since the daily count of names printing new 52-week highs versus new lows is a long-running gauge of how broad a rally or decline really is.
How to identify all-time and 52-week extremes
The levels come from the data; the work is confirming you are marking the right prints.
- 1Zoom out to a weekly or monthly chart with full listing history; the ATH is the highest print on record, so confirm whether the data is split- and dividend-adjusted first.
- 2For 52-week levels, plot a rolling 252-trading-day highest high and lowest low, or apply a tracker that labels them; the 52-week high can fall as old peaks expire from the window.
- 3Mark the prior extremes as horizontal references, preferring a thin S/R zone spanning wick and close over a single tick-perfect line.
- 4Note whether the current 52-week high is also the ATH: a stock at trailing-year highs but far below its record still faces overhead supply, while one at record highs faces none.
How it's calculated
Reference levels marking the highest and lowest prices in the symbol's full recorded history and within the trailing 52 weeks.
Many vendors compute 52-week levels from daily closes rather than intraday highs and lows, so published figures differ slightly across sources.
All-time values depend on how deep the vendor's history goes and on split and dividend adjustments.
How traders use it
- As reference support and resistance: a prior all-time or 52-week high often acts as resistance on early tests, and once broken it is watched for a flip into support on the retest, following the standard level interaction rules.
- As breakout filters in trend systems: buying new 52-week highs is the long-lookback version of channel breakout logic, kin to Donchian-style rules, on the premise that fresh extremes mark an established trend.
- As context: distance below the ATH gauges drawdown depth, distance above the 52-week low gauges recovery, and the count of names making new 52-week highs or lows serves as a market-breadth input.
- In confluence work: an extreme gains standing when it coincides with independent references, such as a weekly supply zone or a Fib retracement of the decline it is recovering from.
- For targets in discovery: with no history above the ATH, traders project references using measured moves and Fib geometry tools, and watch round numbers or option strike walls where hedging concentrates.
All-time & 52-week extremes vs other reference levels
Prior Period Levels: Prior day, week, and month highs and lows are the short-lookback siblings: same logic, faster turnover. Trailing-year and all-time extremes update rarely and draw broad attention when they break; prior-period levels refresh on schedule and matter most intraday.
Floor Pivots: Floor pivots are formula levels computed from the prior session, so they can sit where nothing ever traded. All-time and 52-week extremes are actual prints where real position-taking happened, the usual argument for their memory.
Period Opens: Period opens mark where a day, week, month, or year began trading; extremes mark the edges of the traveled range. Opens split price into above or below from the first bar; extremes engage only when price nears the boundary of its history.
Concept family
Support/Resistance & Levels
38 concepts mapped · 38 in the Library
All-time & 52-week Extremes FAQ
Turn All-time & 52-week Extremes into a trading strategy.
Take any implementation from this page into Quant, then build on it, backtest it on real data, and keep refining it in conversation.