Pivot Point Profile
 By LuxAlgoJul 4, 2024
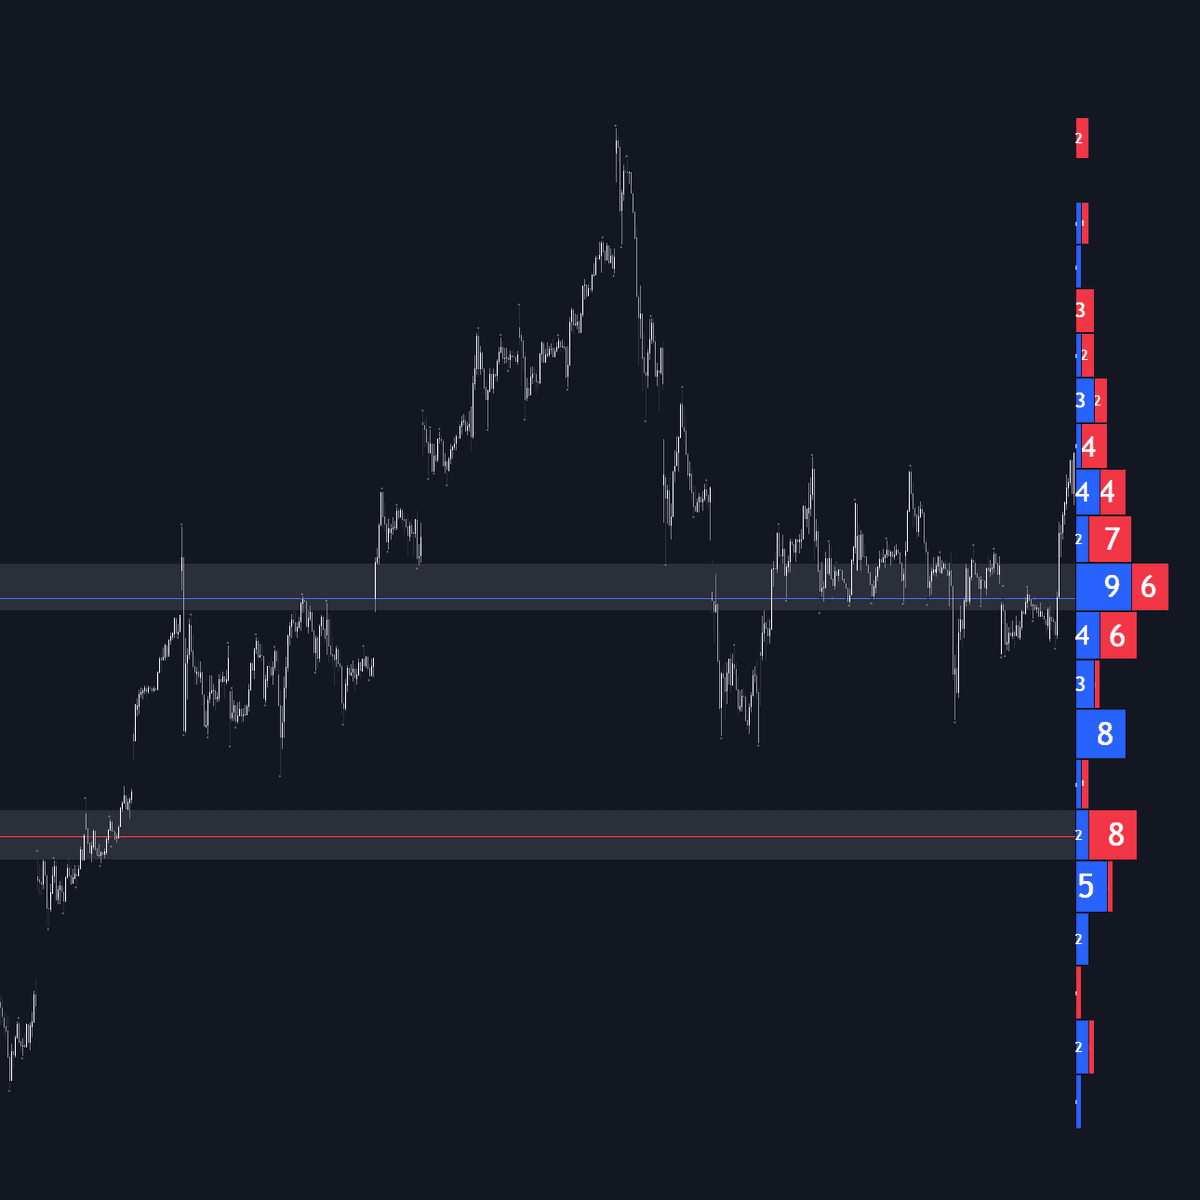
Pivot Point Profile borrows the volume-profile format and fills it with swing points instead of volume: every pivot high and pivot low inside the lookback is binned into horizontal rows, and each row's width shows how many swings printed there. The busiest rows in each direction become Concentrated Areas (CAs), outlined with a line marking the average of the pivots inside — a ranked map of the prices where reversals keep happening.
How to Trade the Pivot Point Profile?
- Wide rows: many historical pivots at one price — treat the row as an S/R zone likely to matter again on the next visit.
- Pivot-low-dominated rows: a floor buyers have defended repeatedly; holding it favors continuation higher, losing it warns buyers have stepped away.
- Pivot-high-dominated rows: the mirror read — a ceiling to respect until it decisively breaks.
- CA average lines: the cleanest single price inside each Concentrated Area for planning entries and reactions around.
Reading highs and lows separately tells you who defended a level; reading the whole row tells you how significant the zone is.
Pivot Point Profile Settings
- Pivot Type: the swing detection basis — "Fractal Pivots" or "SMC Structure".
- Length: pivot calculation length; higher values keep only larger swings.
- Lookback: how many high/low pivot pairs feed the profile; Use Full Chart History overrides it to use all available data.
- Row Size: row count for the profile (up to 250) — more rows sharpen prices, fewer rows group pivots into broader zones.
- Profile Width / Profile Offset / Direction: span in bars, distance from the latest candle, and Left/Right/Center orientation.
- Highlight CAs / CA Threshold / CA Averages: extend concentrated rows, tune what qualifies, and toggle the per-direction average lines.
Frequently Asked Questions
How is this different from classic pivot point levels?
Pivot Points project levels forward from a formula on the prior period's prices. Pivot Point Profile works from evidence instead, counting where actual swing reversals clustered — the two answer different questions and stack well together.
Should I read pivot highs and lows together or separately?
Both. The complete row measures how much attention a zone has earned overall, while the high/low split hints at the likely reaction: a row built from pivot lows reads as defended support, one built from pivot highs as supply.
How do I access the Pivot Point Profile?
It's free in the LuxAlgo Library — add it to your chart from this page, or load it into Quant, LuxAlgo's AI, to test ideas built on its levels without leaving the page.
Free indicator
Get free access to this indicator on the platforms below.

The Library is free. Quant makes it yours.
Pull any concept or indicator into Quant: rebuild it, retune it, or turn it into a backtested strategy of your own.