Concept
Level Clustering Algorithms
Level Clustering Algorithms are Support/Resistance & Levels concepts. The Library holds 6 implementations, each one a working definition you can pull into Quant.
pivot-based. k-means → machine-learning
Top Level Clustering Algorithms indicators
The top custom implementations, built on the original standard Level Clustering Algorithms formula.
6 total
Any of the 6 Level Clustering Algorithms implementations below can become a backtested trading strategy — describe your rules and Quant writes the code.
.png&w=3840&q=75)
What are Level Clustering Algorithms?
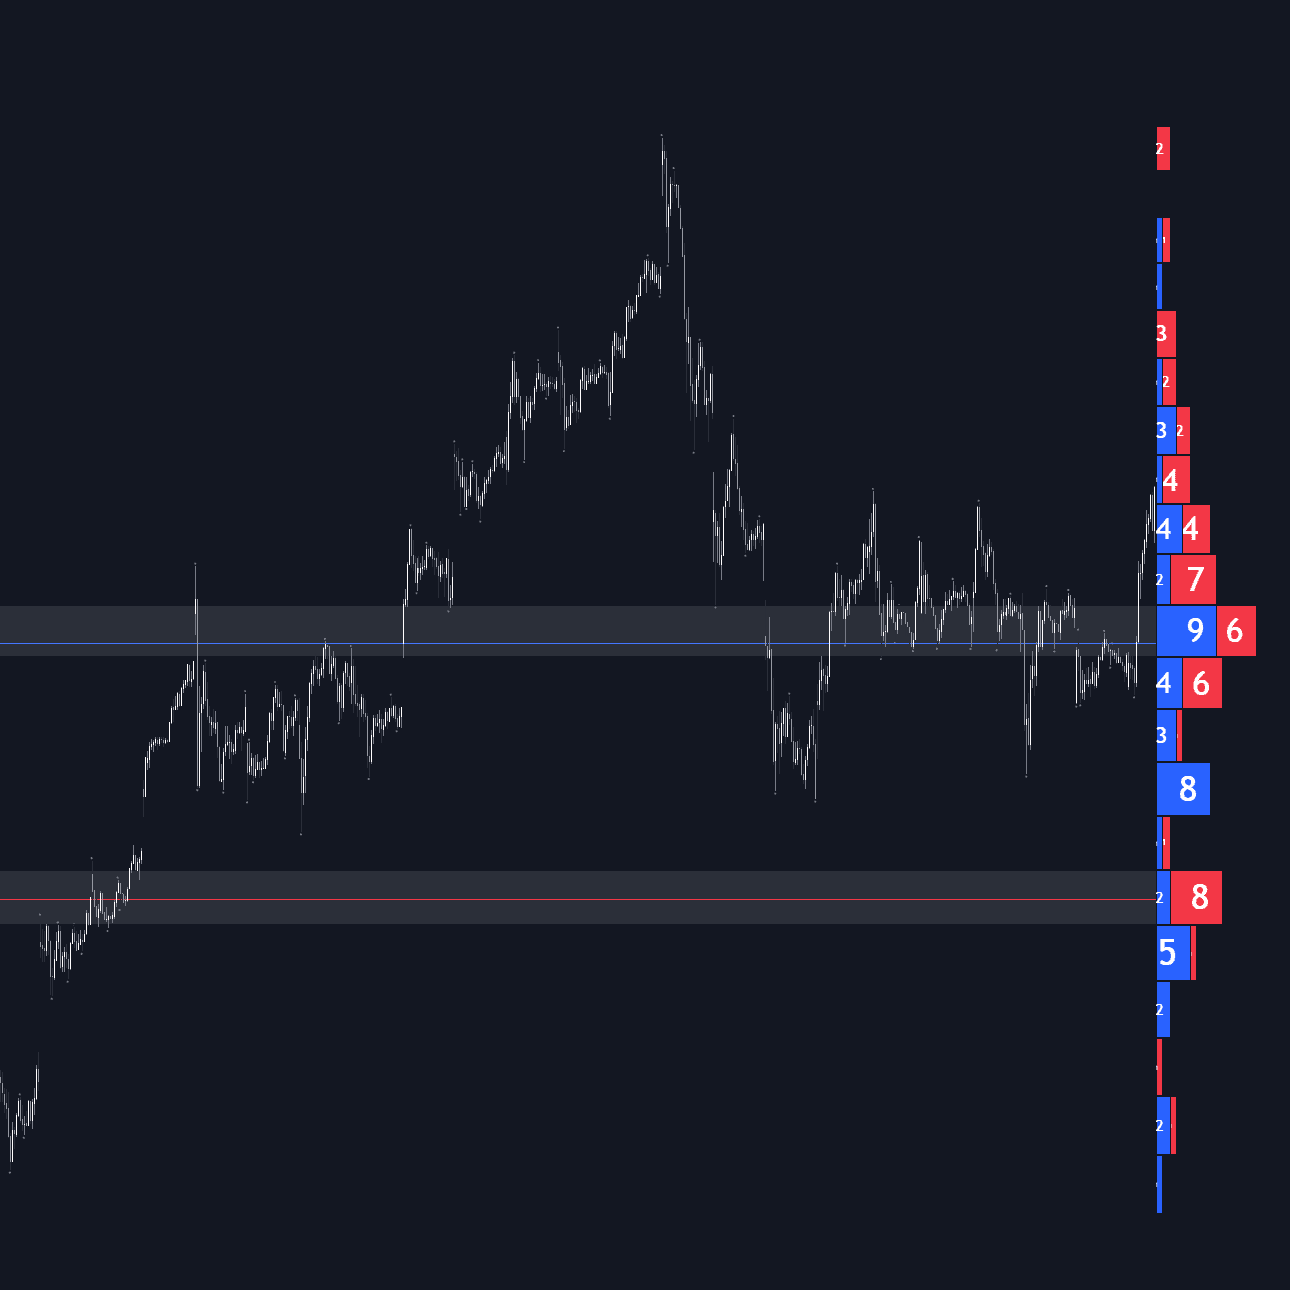
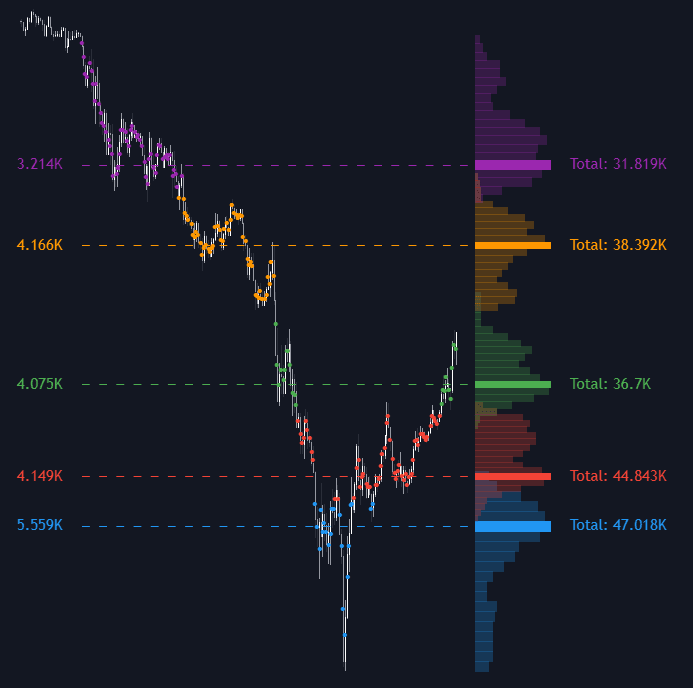
Level clustering algorithms turn a chart's scattered price extremes into a short, ranked list of support and resistance levels. The problem they solve is that price rarely respects an exact tick twice: swing highs and lows land near each other, not on top of each other. A clustering pass groups nearby prices within a tolerance and treats each group as one level or zone, which is how an indicator draws three meaningful lines instead of eighty noisy ones.
Most implementations follow the same pipeline: collect candidate points (swing pivots, candle extremes, sometimes volume peaks), merge candidates that sit within a distance threshold (a fixed percentage, tick count, or ATR multiple), then score each grouping by touch count, recency, timeframe, or traded volume and keep the strongest few. Fancier variants replace the merge step with k-means clustering on price, or with kernel density estimation, where peaks of the price density become the levels. The output is only as objective as its parameters: lookback and tolerance choices mean two algorithms can draw honestly different maps of the same chart.
The algorithm menu is worth knowing because each choice biases the map. Simple agglomerative merging is transparent but order-dependent at the margins. K-means requires choosing the number of levels in advance and will manufacture exactly that many, whether the chart supports them or not. Density estimation turns the choice into a bandwidth: narrow bandwidths fragment the map into many thin levels, wide ones smear distinct shelves together. Candidate choice matters just as much; some maps admit formula-based prices such as floor pivots or period opens alongside detected swings, and scoring commonly multiplies touch count by a recency decay and a timeframe weight.
LuxAlgo ships several implementations of the idea. Support Resistance Classification detects and classifies levels by strength; Pivot Point Profile histograms pivot prices across the lookback, which is density estimation in all but name; and Liquidity Clusters Magnitude applies the grouping logic to estimated liquidation prices, ranking zones by the size of what rests there. The shared honesty requirement is parameter disclosure: every map is conditional on its lookback, tolerance and scoring weights, and levels can appear or vanish simply because old pivots rolled out of the window.
How a level clustering algorithm works
Implementations differ in detail, but nearly all run the same stages.
- 1Collect candidates: detect swing highs and lows across a lookback window using pivot detection, fractals, or zigzag filtering, and pool their prices.
- 2Group by proximity: merge candidates that fall within the tolerance distance into a single group. The tolerance is the most sensitive setting; too tight fragments levels, too loose smears them together.
- 3Score each grouping: more touches, more recent touches, higher-timeframe origin, and heavier volume at the price all raise a group's rank.
- 4Render the survivors: the top-ranked groupings print as lines, or as zones whose width reflects the spread of prices inside the group.
- 5Stress-test the parameters: nudge the lookback and tolerance and watch which levels survive; robust levels persist across settings, fragile ones are artifacts of one configuration.
How traders use it
- To automate the S/R map: clustered levels are rule-based and reproducible, removing the subjectivity of hand-picking which highs and lows count.
- To trade zones instead of lines: a group's internal spread gives a natural zone width, which absorbs the near-misses that make tick-perfect levels unusable.
- To filter signals: breakout and reversal setups can be gated to fire only at high-scoring clusters, cutting trades taken at weak or stale levels.
- To weight timeframes: clustering each timeframe separately and boosting higher-timeframe clusters yields one map in which the levels most participants care about rank highest.
- To feed downstream logic: the ranked map becomes the stable input for level interaction rules and freshness tracking, so bounce and break playbooks reason about a few maintained levels rather than raw pivot noise.
Level Clustering Algorithms vs related concepts
S/R Zone: The zone is the output; the clustering algorithm is the machinery. A hand-drawn zone encodes judgment about one chart, while a clustered zone encodes pivot statistics over a defined lookback with stated rules.
Volume Profile: A volume profile clusters traded volume by price and surfaces high-volume nodes; level clustering typically groups price extremes regardless of volume. Both locate prices of interest, from different raw material.
K-means Regime Clustering: Same algorithm family, different target. K-means over price values yields horizontal levels; k-means over volatility and trend features classifies market regimes through time.
More Level Clustering Algorithms implementations
Concept family
Support/Resistance & Levels
38 concepts mapped · 38 in the Library
Level Clustering Algorithms FAQ
Turn Level Clustering Algorithms into a trading strategy.
Take any implementation from this page into Quant, then build on it, backtest it on real data, and keep refining it in conversation.