Concept
S/R Zone
S/R Zone is a Support/Resistance & Levels concept. The Library holds 19 implementations, each one a working definition you can pull into Quant.
vs line
Top S/R Zone indicators
The top custom implementations, built on the original standard S/R Zone formula.
19 total
Every S/R Zone implementation here is strategy-ready: open one in Quant, set your rules, and it backtests automatically.
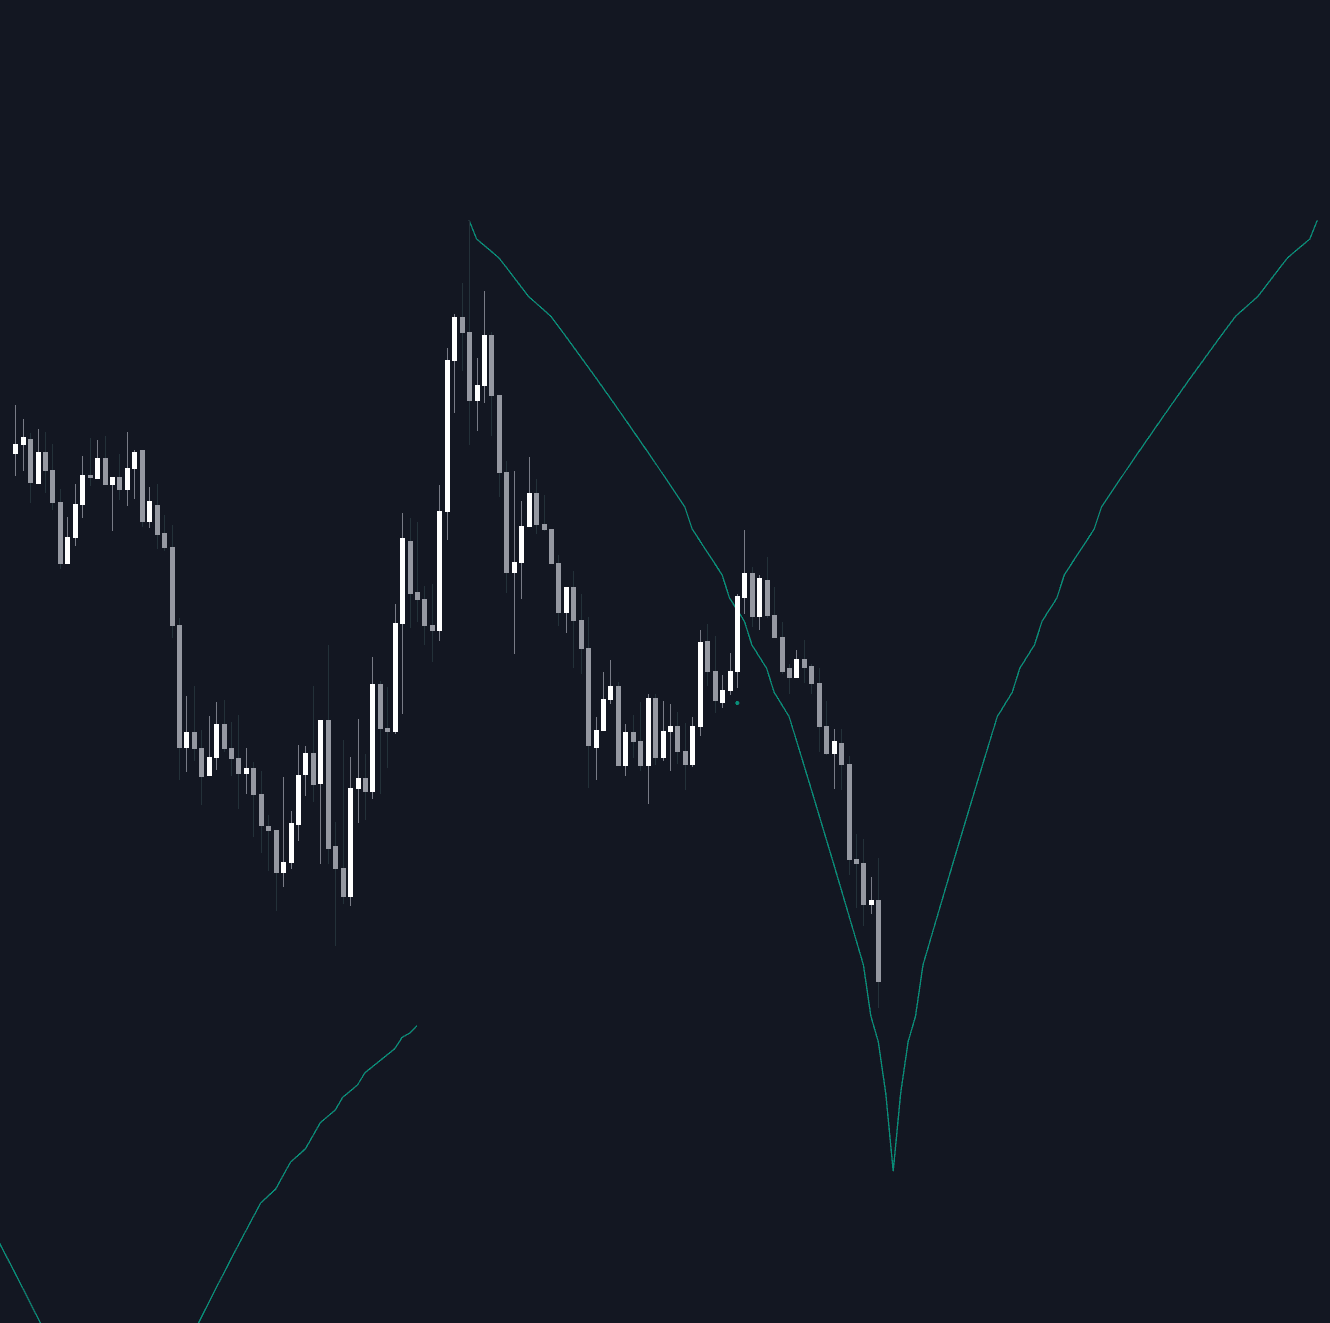
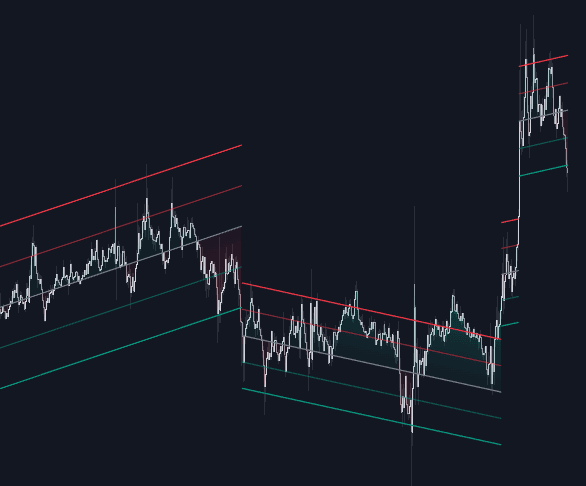
.png&w=3840&q=75)
What is an S/R Zone?
An S/R zone is support or resistance drawn as a band rather than a single line. Instead of claiming the market respects one exact price, the zone spans the area where prior reversals actually printed: the scatter of wicks, bodies, and closes around the swing highs and lows that define the level. Price rarely turns at the same tick twice, and the zone is the honest admission of that.
Reversals scatter for structural reasons. Participants anchor to different references: some to wick extremes, some to candle bodies, some to round numbers sitting nearby, and different timeframes resolve the same turn at slightly different prices. A zone absorbs that dispersion. Its edges are commonly set from the extreme wick of the defining touches to the nearest cluster of bodies, and its width should scale with timeframe and volatility: wide enough to contain normal noise, narrow enough to still be actionable.
Zones matter because they set the geography of a trade: entries staged inside the band, stops placed beyond its far edge, targets trimmed ahead of the next zone over. They are also perishable. Each test consumes some of the resting interest that made the area react, so heavily revisited zones are commonly discounted (level freshness and decay), and a decisive close through the band converts it into a role reversal candidate rather than a level worth defending.
How to identify an S/R zone
Zones are drawn from price memory already on the chart: places where multiple reversals printed close together.
- 1Mark the turning points. Find at least two swing reversals that printed in roughly the same area; independent touches from separate visits count for more than a single choppy episode.
- 2Set the edges. A common convention runs the outer edge through the extreme wick of the touches and the inner edge through the nearest candle bodies, so the zone captures both the aggressive and conservative reads of the level.
- 3Scale the width. Zones should widen with timeframe and volatility; many traders sanity-check width against ATR so the zone stays small relative to the moves they are trading, and treat anything wider as context rather than an entry area.
- 4Maintain the map. On each revisit, record whether the zone produced a reaction or was traded through; archive zones that have been cleanly broken, or flip them to the opposite role and watch how price treats them from the other side.
How traders use it
- As an entry area rather than an entry price: price may travel anywhere inside the band, so the trigger is a reaction at the zone (a rejection wick, an engulfing close) instead of the first touch of a line, which filters some false breakouts that pierce a single line by a few ticks.
- For stop placement: stops belong beyond the far edge of the zone plus a noise allowance, so a position survives ordinary wick traffic through the middle of the band instead of dying at the first probe.
- For breakout logic: the common breakout definition is a full-bodied close beyond the zone, not a wick through it, and the broken band then becomes the natural retest area for continuation entries.
- As a confluence layer: a zone that stacks with other references (a round number, a high-volume shelf, a fib level) carries more weight, and scoring systems commonly weight zones by touch count, age, and freshness.
S/R Zone vs related concepts
Support Level: The single-line version: one precise price, easy to alert and backtest, brittle against wick noise. The zone trades that precision for tolerance; many traders keep a line inside the band for execution.
Supply & Demand Zones: Also bands, but constructed from the origin of an impulsive departure (a base) rather than from repeated touches, and conventionally strongest untested, whereas S/R zones are defined by their touch history.
Bullish/bearish Order Block: The Smart Money Concepts cousin: a zone drawn from the last opposing candle before a displacement, with its own refinement and mitigation rules, rather than from clustered reversal prints.
Value Area: A volume-derived band: the range holding roughly 70% of a period's traded volume. It describes where the market did business, not where it reversed, though the two often overlap.
More S/R Zone implementations
- Volumetric Toolkit
- Wave Consolidation
- Support Resistance Classification
- Luminance Breakout Engine
- NFP Price Zones
- Peak Activity Range
- Pivot Point Profile
- Range Intelligence Suite
- Structural SVM Ranker
- Support Resistance Classification (VR)
- Candle Body Support/Resistance
- Support & Resistance Pro Toolkit
- 8am Road Map Zone
- Support & Resistance Zones Strength Classifier
- Support and Resistance Signals MTF
- Support and Resistance Levels with Breaks
Concept family
Support/Resistance & Levels
38 concepts mapped · 38 in the Library
S/R Zone FAQ
Turn S/R Zone into a trading strategy.
Take any implementation from this page into Quant, then build on it, backtest it on real data, and keep refining it in conversation.