Pivot Points
 By LuxAlgoMay 28, 2026
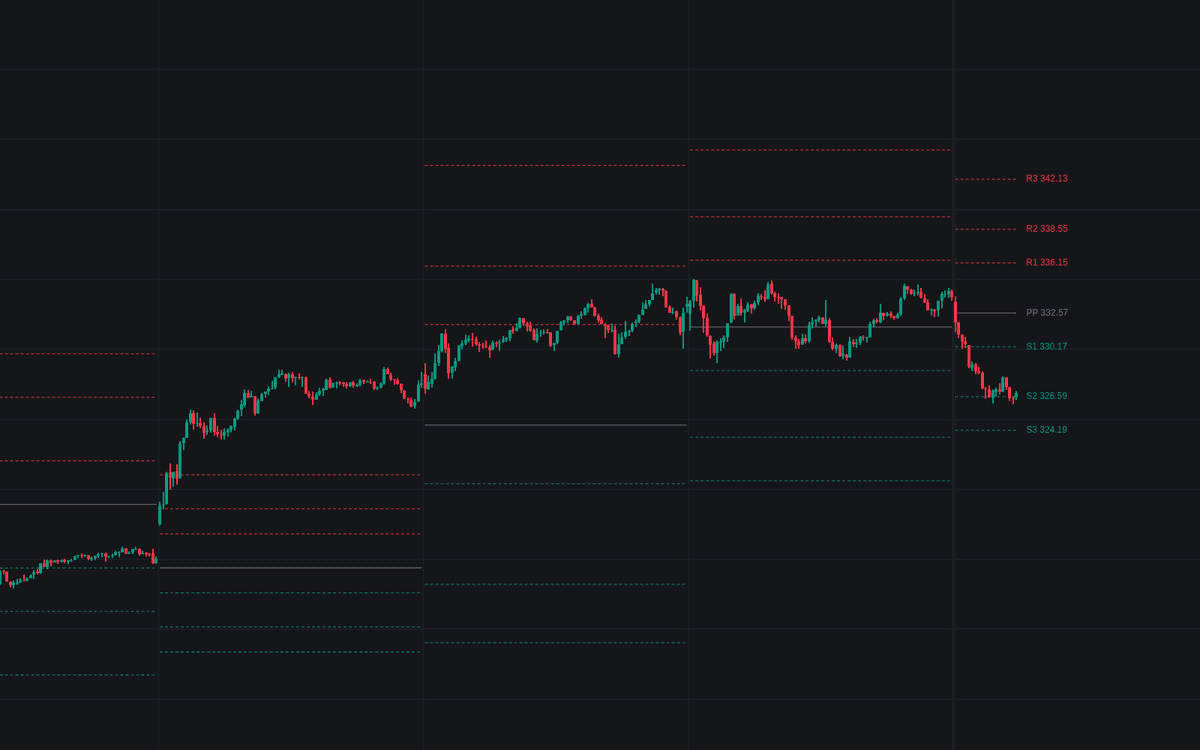

Pivot Points projects the original floor-trader ladder of pivot points onto the current period: the central pivot averages the prior period's high, low and close, and up to three resistance and support rungs reflect around it. Each new day, week or month freezes the elapsed ladder into history and draws a fresh one, so the chart keeps a visible record of how price treated past projections, not just today's lines.
How to Trade the Pivot Points?
- Price above or below PP: the standard session lean. Above the central pivot favors the long side of the ladder, below it the short side. Crossing alerts cover both directions.
- First test of a rung: the initial touch of PP, R1 or S1 each period is the cleanest reaction point, before the level has been chewed through; dedicated first-test alerts mark them.
- Rung crosses: alerts fire on closes through every rung out to R3/S3, with crossings on the re-anchoring bar ignored since those come from the level jump, not a price move.
Past ladders (Periods Shown) are the built-in review tool: scan how recent periods respected their projected levels before leaning on today's.
Pivot Points Settings
- Anchor Period (default Auto): the prior period the ladder is computed from. Auto picks Daily on intraday charts, Weekly on daily, Monthly above that. Longer anchors move slower.
- Support/Resistance Rungs (default 3): rungs reflected around the central pivot, from R1/S1 out to R3/S3.
- Periods Shown (default 5): anchor periods, current included, whose ladders stay on the chart.
- Show Labels and Show Prices in Labels (both on), plus line style, color and width controls for the pivot and the rungs.
Frequently Asked Questions

Original indicatorBuilt in-house by LuxAlgo
The Library is free. Quant makes it yours.
Pull any concept or indicator into Quant: rebuild it, retune it, or turn it into a backtested strategy of your own.