Stablecoin Dominance
 By LuxAlgoFeb 15, 2024
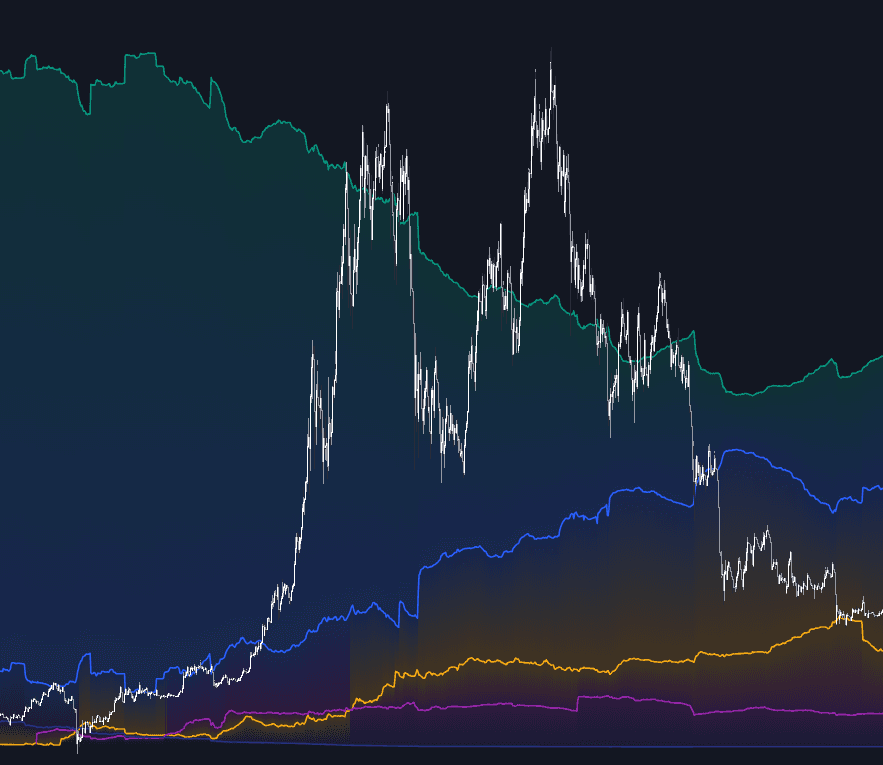
Stablecoin Dominance maps the balance of power among the major dollar-pegged tokens — USDT, USDC, BUSD, DAI, and TUSD — by charting each coin's share of the group's combined supply. It turns stablecoin supply data into a picture: dominance for each coin is its supply divided by the total across every coin you enable, so issuer migrations, regulatory shocks, and the rise of new leaders appear as area shifts rather than rows of numbers.
How to Trade the Stablecoin Dominance?
- One coin's share rising: supply rotating toward that issuer — frequently the footprint of changing market preference or a rival's troubles.
- Overlay on price: keeping the graph on the price chart makes correlations between dominance shifts and market moves easy to spot; it works equally well in a separate pane.
- Toggling coins: disabling a coin removes it from the denominator entirely, so narrowing the list sharpens the comparison — much as a ratio chart isolates two instruments.
The stablecoin market evolves quickly: new tokens arrive, rules change, dominance migrates. Watching the shares shift is a compact way to track how each event redistributes the ecosystem that the rest of crypto trades against.
Stablecoin Dominance Settings
- Fill Style: "Gradient" (default), "Solid" for distinct per-area colors and lighter rendering, or "None" to remove the area display.
- Stablecoins List: enable or disable each coin; disabled coins are excluded from the dominance computation.
Frequently Asked Questions
How is dominance calculated?
Each coin's dominance is its total supply divided by the combined supply of all enabled stablecoins. The denominator follows your selection, so the chart always shows shares of exactly the basket you chose.
Why watch stablecoin dominance at all?
Because it records how the market's dollar liquidity migrates between issuers over time, and those migrations often coincide with regulatory events or shifts in trader preference. For the same rotation lens across crypto assets more broadly, the Relative Crypto Dominance Polar Chart extends the idea beyond stablecoins.
How do I get the Stablecoin Dominance tool?
The tool is free on its LuxAlgo Library page, and you can pull it into Quant, LuxAlgo's AI, right here — a quick way to line dominance shifts up against price history.
Free indicator
Get free access to this indicator on the platforms below.

The Library is free. Quant makes it yours.
Pull any concept or indicator into Quant: rebuild it, retune it, or turn it into a backtested strategy of your own.