Weekly Stacked Daily Changes
 By LuxAlgoNov 27, 2024
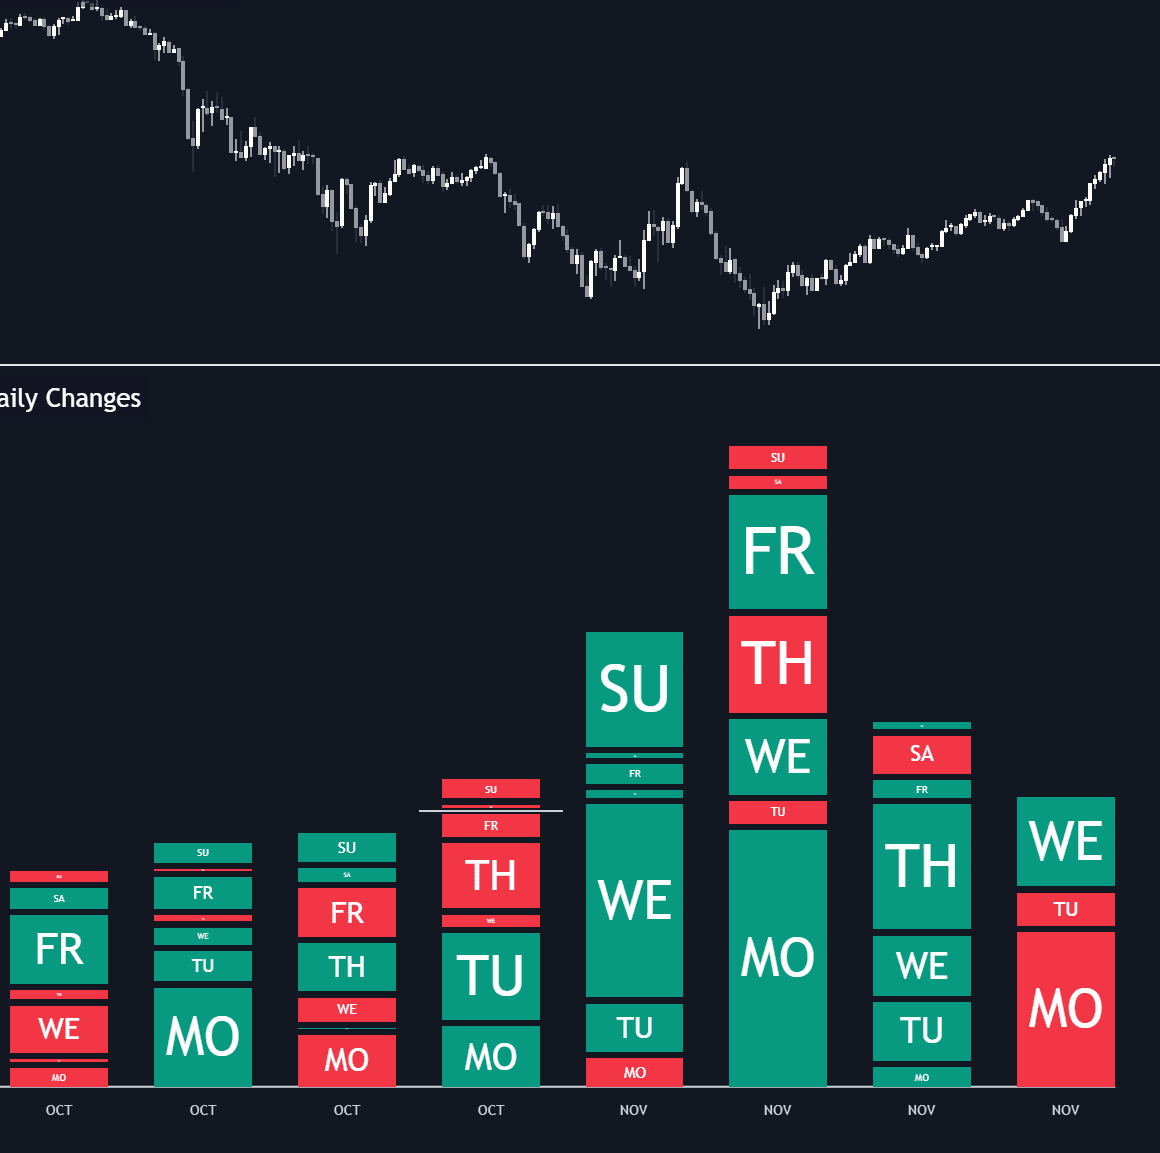
Weekly Stacked Daily Changes draws each week as a stacked column of its daily net price changes, putting weekday behavior and weekly volatility side by side. It is a compact way to study day-of-week effects on any symbol: tall stacks flag volatile weeks, and the mix of bullish and bearish boxes inside each stack shows which days did the work. No initial configuration is needed — the tool renders out of the box, with widths, spacing, colors and month markers left to taste.
How to Trade the Weekly Stacked Daily Changes?
- Stack height: compare column heights to spot volatility regimes — runs of tall stacks mark expansion, short stacks mark quiet weeks.
- Box composition: the same weekday repeatedly printing bullish or bearish boxes hints at recurring session behavior worth investigating.
- Bottom Stack Bias off: all stacks share a zero baseline, so height alone ranks weekly volatility.
- Bottom Stack Bias on: each stack pivots on its weekly net change — a stack starting below the zero line was a negative week, one starting above was positive.
Month names and boundary lines keep longer studies organized, so scanning a quarter of weekday behavior takes one pass — a natural companion to the library's other time and seasonality tools.
Weekly Stacked Daily Changes Settings
- Width: fixed width of each weekly column.
- Offset: the gap between columns.
- Spacing: the distance between the days inside a column.
- Bottom Stack Bias: uses the weekly net price change as the stack's bottom boundary.
- Style inputs cover Bullish Change and Bearish Change colors plus the Show Months and Show Months Delimiter toggles.
Frequently Asked Questions
What does Bottom Stack Bias actually change?
It swaps the baseline. Disabled, every stack starts at zero and heights compare raw volatility; enabled, the weekly net change becomes the pivot, so a stack opening below zero immediately reads as a losing week and one above as a winning week.
Which tool should I use for weekday statistics?
This indicator shows the raw week-by-week picture; the Day of Week Price Distribution aggregates behavior per weekday instead. Running both works well — one for structure, one for statistics.
Is Weekly Stacked Daily Changes free to use?
Yes. It sits on the free side of the LuxAlgo Library, available from this page, and it runs in LuxAlgo's AI (Quant) whenever you want to dig into weekday patterns hands-on.
Free indicator
Get free access to this indicator on the platforms below.

The Library is free. Quant makes it yours.
Pull any concept or indicator into Quant: rebuild it, retune it, or turn it into a backtested strategy of your own.