Concept
Seasonality Tooling
Seasonality Tooling, also known as N-year average paths, consistency score, heat maps, is a Time, Sessions & Seasonality concept. The Library holds 8 implementations, each one a working definition you can pull into Quant.
Top Seasonality Tooling indicators
The top custom implementations, built on the original standard Seasonality Tooling formula.
8 total
Every Seasonality Tooling implementation here is strategy-ready: open one in Quant, set your rules, and it backtests automatically.
What is Seasonality Tooling?
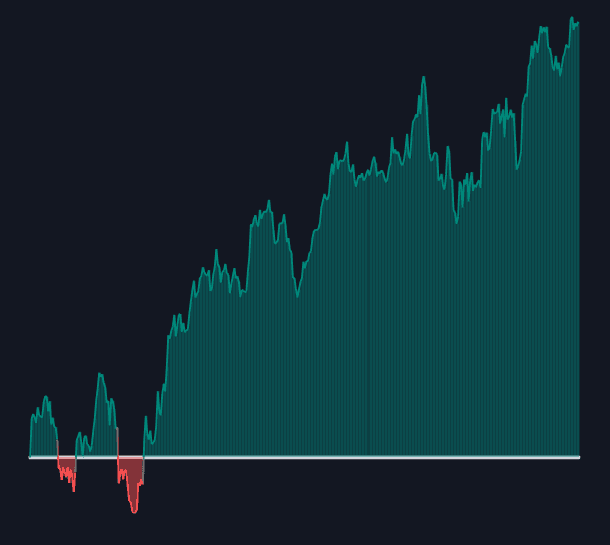
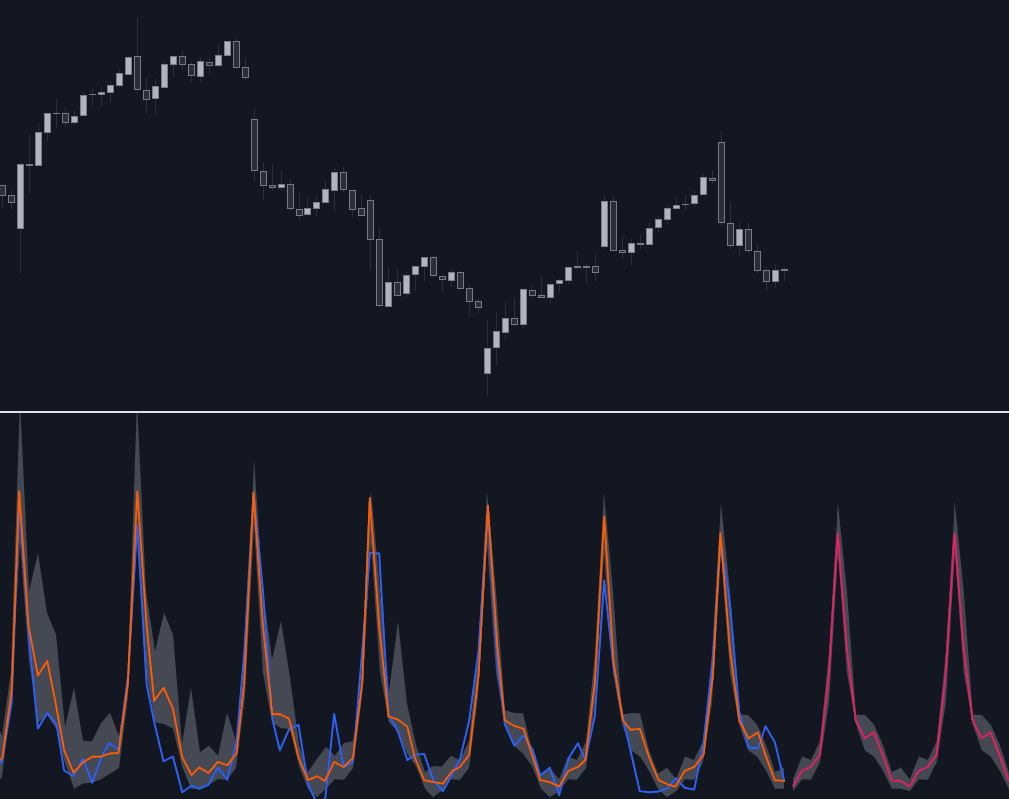
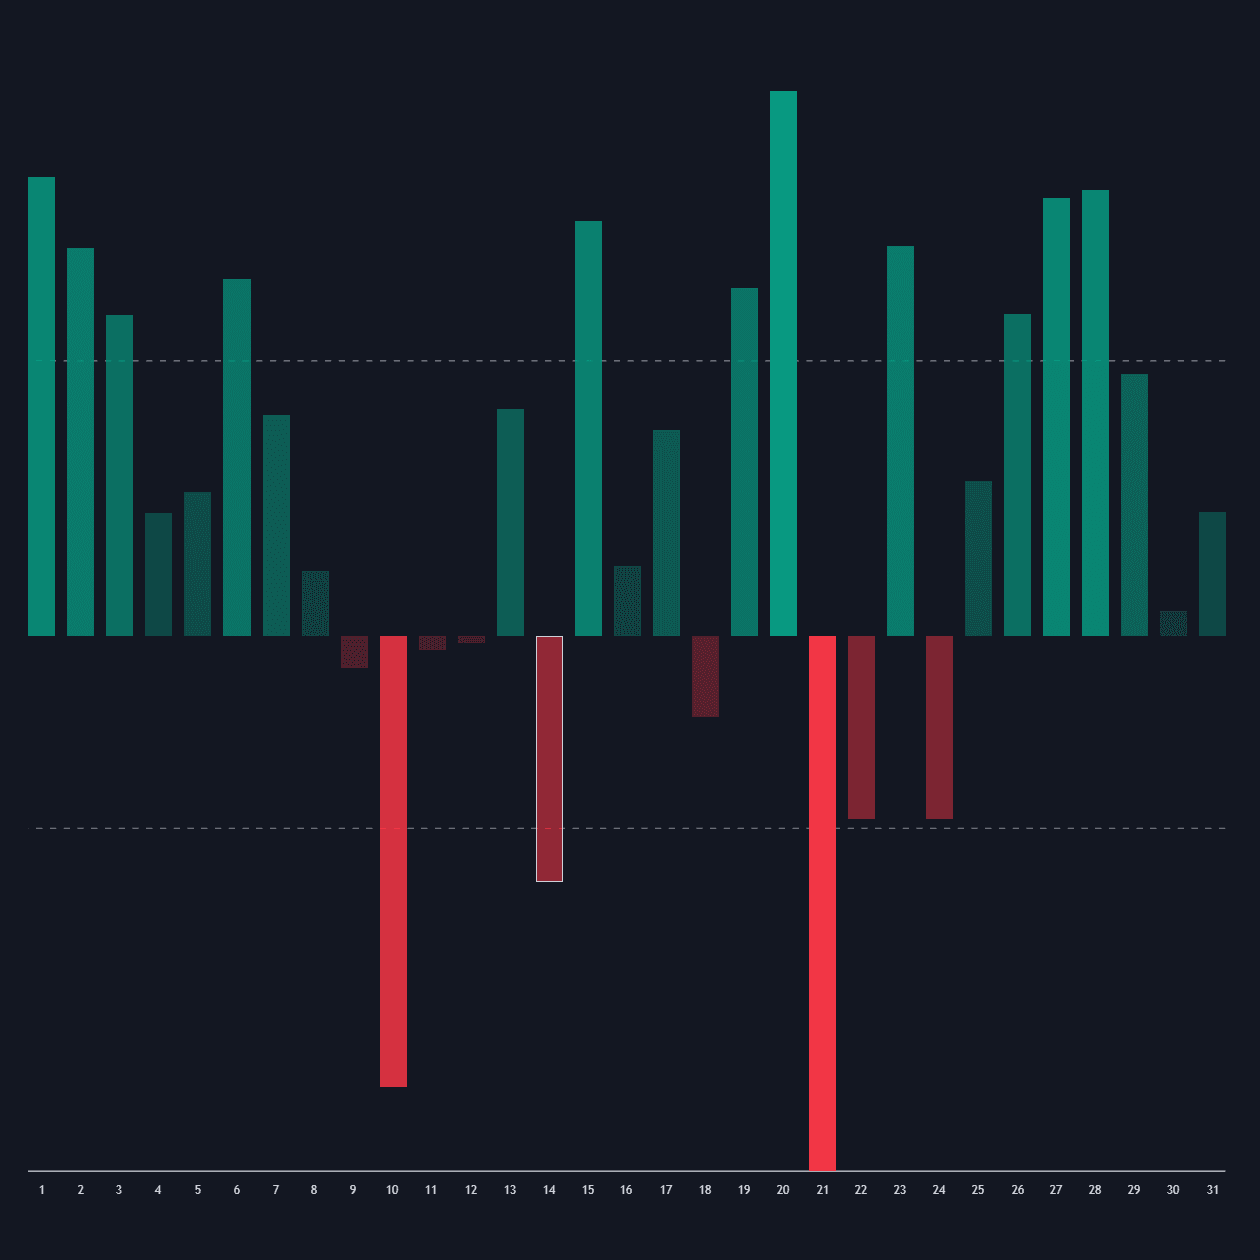
Seasonality tooling is the set of displays and statistics that make calendar tendencies inspectable: N-year average paths, return matrices and heat maps, and consistency scores. An average path normalizes each historical year to a common starting point and averages the trajectories into a 'typical' shape, with the current year overlaid for comparison. Return matrices tabulate returns by bucket (years down the rows, months or weekdays across the columns) so strong and weak periods stand out at a glance, and a consistency score counts how often a bucket moved in the same direction.
The tooling matters because raw seasonal averages mislead easily: twenty years of data is only twenty observations per month, and one outlier year can dominate a mean. Good seasonality work reads the average path together with its consistency and dispersion, and treats the output as a base rate for month-of-year seasonality or day-of-week effects, not a forecast.
Calendar analysis predates the software: Yale Hirsch's Stock Trader's Almanac, first published in 1967, popularized calendar effects such as the January Barometer and the Santa Claus rally, and academic studies of weekday and turn-of-month effects followed. Many published tendencies weakened after becoming widely known. Modern tooling compresses what once took a spreadsheet and patience into on-demand computation: charting platforms and indicators such as LuxAlgo's Seasonality Chart assemble these displays for any symbol with sufficient history.
Small construction choices change the picture. Averages can be arithmetic or median-based, years can be equally weighted or recency-weighted, and paths can be aligned by calendar date or by trading day, which matters around month ends and holidays. The same machinery also scales down to intraday work: statistics bucketed by trading session, time-of-day averages, and session high/low tendencies are seasonality tooling applied to the clock instead of the calendar.
It also helps to know what the tooling is not. Seasonality anchors to fixed calendar positions, which distinguishes it from fixed time cycles counted in bars and from adaptive cycle estimation that lets the period float. And because any sufficiently large matrix will contain impressive-looking squares by chance, the displays are best treated as hypothesis generators whose outputs still need testing, especially for long-horizon calendar claims that rest on a handful of occurrences.
How to read seasonality tooling on a chart
Seasonality displays are read rather than spotted; the skill is checking the statistics behind the picture before trusting it.
- 1Overlay the current year on the N-year average path and judge tracking by shape and turning points rather than exact levels, since the path is normalized.
- 2Open the return matrix or heat map and read down each column: a strong average with mixed signs is often an outlier artifact, while a strong average with consistent signs is a genuine tendency.
- 3Check the consistency score and the sample size behind any bucket you care about; an average built from six years is six observations, however smooth it looks.
- 4Cross-reference macro event days; recurring scheduled releases inside a bucket can masquerade as calendar seasonality.
- 5Confirm whether the statistics are computed on regular hours or the full session, because RTH and ETH samples can differ materially for the same symbol.
How it's calculated
Statistics that summarize how an instrument has typically behaved at the same point of the calendar across a sample of past years.
Slots must be aligned consistently, by trading-day number or by calendar date; February 29 and holiday gaps are dropped or forward-filled.
Median paths and log returns are common robust alternatives to the arithmetic mean shown here.
Small N overfits, and a consistency score near 50 percent means the slot carries no seasonal edge.
How traders use it
- Overlaying the current year on an N-year average path to judge whether price is tracking, leading, or diverging from its typical seasonal shape; divergence is information, not a sell signal.
- Scanning heat maps and return matrices to find which months, weekdays, or sessions historically carried a symbol's gains, then checking the consistency score before trusting any single bucket.
- Stress-testing a seasonal claim: recompute the average with the best and worst year removed, or with medians instead of means, and see whether the tendency survives; robust tendencies do, artifacts do not.
- Timing execution within an existing thesis: seasonal buckets and session open/close behaviors help schedule entries, adds, and rebalances toward historically supportive windows.
- Forecasting activity rather than direction: the same averaging applied to volume anticipates when participation typically swells or dries up, which helps time executions and flags moves that print on unusual participation.
Seasonality tooling vs related concepts
Month-of-year Seasonality: Month-of-year seasonality is one specific calendar tendency; seasonality tooling is the measurement layer used to test it, alongside weekday, session, and intraday effects.
Fixed Time Cycles: Fixed time cycles are counted in bars and drift free of the calendar, while seasonality pins its buckets to dates; the two frameworks can disagree on the same chart.
Dominant-cycle Detection: Dominant-cycle detection estimates whatever periodicity currently governs price; seasonality tooling assumes the period in advance (a year, a week, a day) and measures behavior within it.
More Seasonality Tooling implementations
Concept family
Time, Sessions & Seasonality
32 concepts mapped · 32 in the Library
Seasonality Tooling FAQ
Turn Seasonality Tooling into a trading strategy.
Take any implementation from this page into Quant, then build on it, backtest it on real data, and keep refining it in conversation.