Accumulation/Distribution
 By LuxAlgoApr 13, 2020
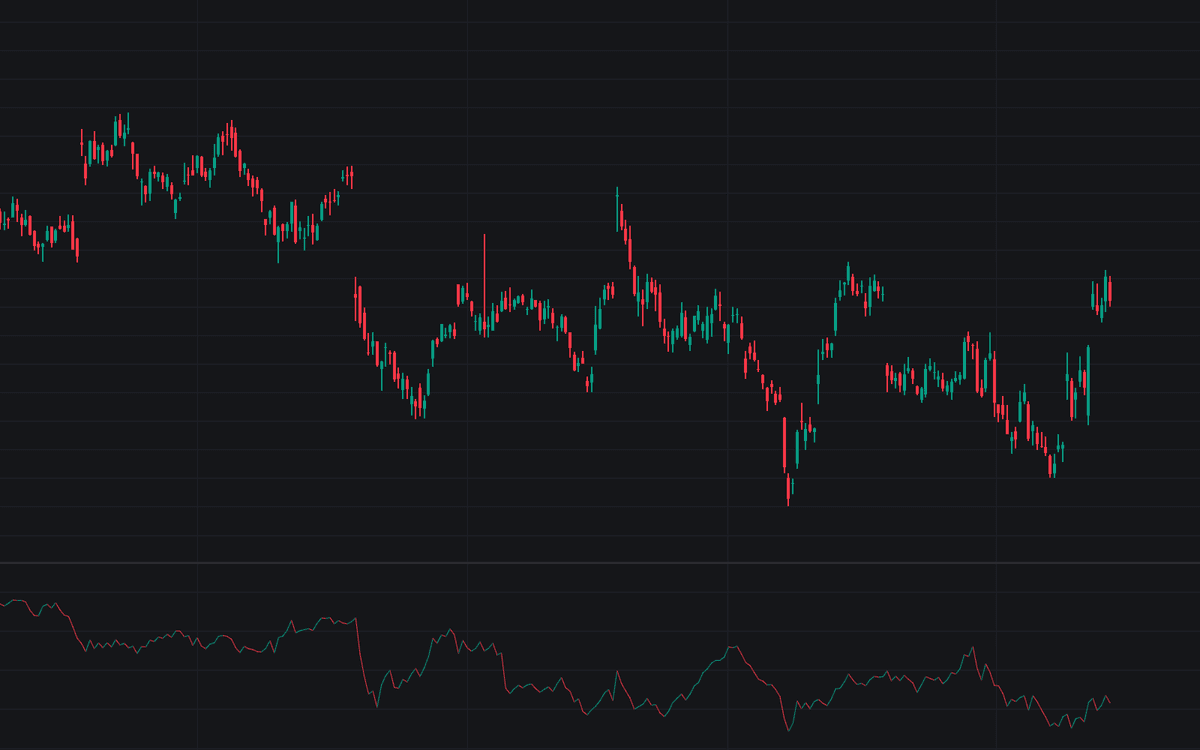

Accumulation/Distribution keeps a running tally of volume-weighted pressure, crediting each bar's volume in proportion to where the close lands within the bar's high-low range. A close near the high pushes the line up, a close near the low pulls it down, and a midrange close adds little either way, so the total tracks whether volume keeps arriving on strong closes or weak ones. This is the standard raw implementation of Marc Chaikin's Accumulation/Distribution Line: cumulative from the start of the loaded history, with no length parameter and no smoothing.
How to Trade the Accumulation/Distribution?
- A/D rising with price: volume is flowing in behind the advance, giving the trend confirmation.
- A/D falling with price: weak closes on volume accompany the decline, confirming the downtrend.
- Price at a new high, A/D at a lower high: bearish divergence. The push is happening on closes that sit lower in their ranges.
- Price at a new low, A/D at a higher low: bullish divergence. Selling pressure is drying up even as price probes lower.
- Slope changes during a trend: a flattening A/D line is the earliest and least reliable warning. Wait for price structure to confirm.
Only the line's direction and how its swings compare with price swings carry information. The absolute number merely reflects where the loaded history begins.
Accumulation/Distribution Settings
The classic A/D Line takes no parameters: a cumulative sum with no lookback window, nothing to tune, no way to misconfigure. The build's only input is the A/D Line color used for the plot; everything else is defined by the formula itself.
Frequently Asked Questions

The Library is free. Quant makes it yours.
Pull any concept or indicator into Quant: rebuild it, retune it, or turn it into a backtested strategy of your own.