Concept
Accumulation/Distribution Line
Accumulation/Distribution Line is a Volume & Order Flow concept. The Library holds 1 implementation, a working definition you can pull into Quant.
Chaikin
The standard Accumulation/Distribution Line indicator
Accumulation/Distribution Line exactly as classically defined: the faithful reference build of the original formula, free to run in Quant.
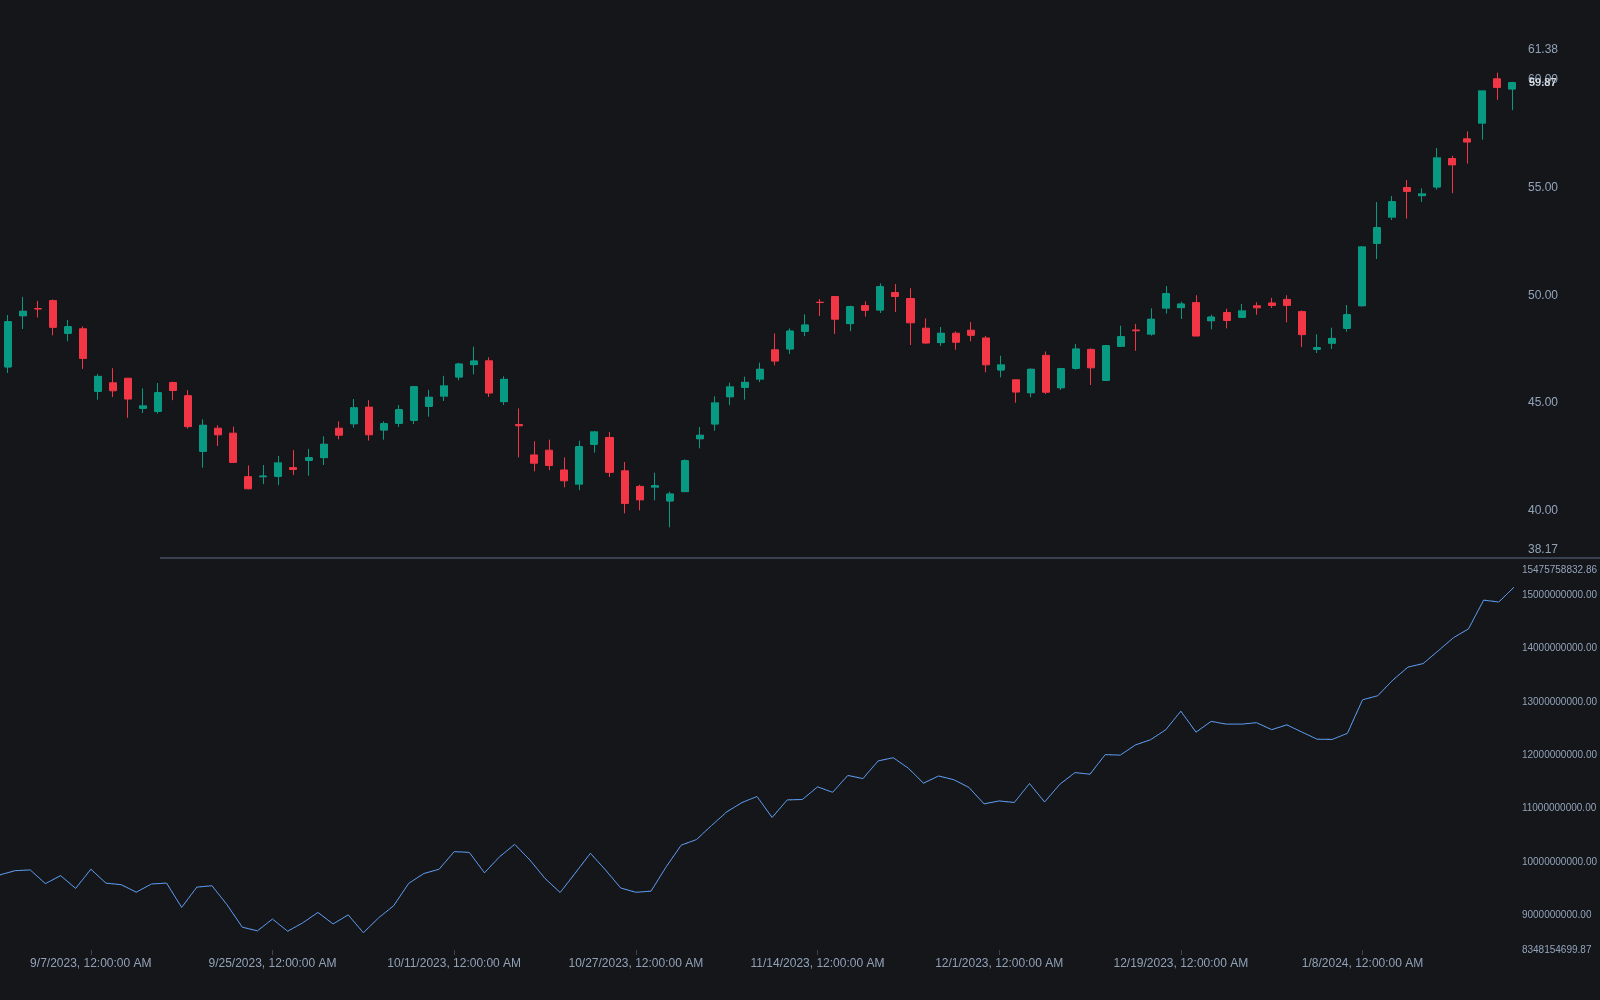
What is the Accumulation/Distribution Line?
The Accumulation/Distribution Line is a cumulative volume-flow indicator created by Marc Chaikin, the Wall Street analyst whose name also attaches to the Chaikin Oscillator and Chaikin Money Flow, both extensions of the same calculation. Developed during his volume work of the 1970s and 1980s, it grades each bar by how it closed rather than treating every bar as entirely bought or entirely sold, the simplification behind earlier cumulative volume tools.
Each bar it computes a money flow multiplier from the close's position within the bar's range: (close minus low) minus (high minus close), divided by (high minus low). The multiplier is +1 when the bar closes at its high, -1 at its low, and 0 at midrange. It scales the bar's volume, and the scaled values accumulate into a running line: closes near the highs on strong volume push it up (accumulation), closes near the lows push it down (distribution).
The line's slope is compared against price. Agreement confirms the trend; disagreement, where price makes an extreme the line refuses to confirm, is the classic volume divergence warning. One known blind spot: the multiplier uses only the bar's own range and never looks at the prior close, so gaps are invisible to it. A stock can gap down hard, close near that day's high, and print positive money flow on a losing day.
Because the line is cumulative, its absolute level means nothing: it depends on where the loaded price history begins, so two platforms can show different values for the same stock and both be right. Only the line's direction, changes in its slope, and the position of its swings relative to price swings carry information, which makes it a confirmation and warning tool rather than a level-based one. It is most trustworthy on liquid instruments whose volume prints are meaningful bar after bar.
How to read the Accumulation/Distribution Line on a chart
The line plots in its own pane, and every reading is a comparison against the price action above it.
- 1Add the indicator below price, ignore its absolute value, and mark its recent direction along with its latest swing highs and lows.
- 2Compare those swings with the corresponding price swings: both rising together confirms demand, both falling together confirms supply.
- 3Flag disagreements, such as a fresh price extreme the line fails to match; that mismatch is the divergence setup to monitor over the following bars.
- 4Scan for gap-heavy sessions before trusting a reading, because the multiplier never sees the jump from the prior close; OBV reacts fully to gaps and makes a natural cross-check.
- 5On intraday charts, compare the line against volume delta, which measures aggressive buying and selling directly instead of inferring it from close location.
How it's calculated
The A/D Line keeps a running total of each bar's volume weighted by where the close finishes inside the bar's high-low range.
When H_t = L_t the multiplier is undefined; implementations typically set that bar's MFV_t to 0 and carry the line forward.
The absolute level depends on where the running total starts, so only the slope and divergences against price are meaningful.
This is Marc Chaikin's definition; Williams' Accumulation/Distribution is a different formula based on the prior close.
How traders use it
- For trend confirmation: a rising line alongside rising price says volume is concentrated near the highs of each bar, while a flattening line under a rising price warns that participation is thinning.
- For divergences: price setting a new low while the line holds a higher low is read as selling pressure drying up, with the mirror image at highs; these are warnings to investigate, not standalone signals.
- For vetting breakouts: a line already rising while price presses a resistance level suggests absorption preceded the attempt; pairing that read with volume at breakout and relative volume helps separate funded moves from empty ones.
- As a base for derived studies: smoothed differences of the line turn it into an oscillator form (the Chaikin Oscillator is the gap between its 3- and 10-period EMAs), and the same close-location weighting appears inside several other volume tools.
- For pairing pressure with location: the line says whether pressure is building or fading, while volume profile and its point of control show which prices hosted the business.
Accumulation/Distribution Line vs related volume tools
OBV: Adds or subtracts each bar's entire volume based on the close-to-close direction. It reacts fully to the gaps the A/D line cannot see, but treats a marginal up-close exactly like a powerful one, which the A/D line grades.
Money Flow Index: A bounded 0-100 oscillator built from typical price and volume, read for overbought and oversold extremes. The A/D line is unbounded and cumulative, read for slope and divergence rather than levels.
Volume Delta: Splits executed volume into buy-side and sell-side aggression using intrabar data. The A/D line approximates the same intent from a single close-location calculation per bar, cheaper to compute but much blunter.
Concept family
Volume & Order Flow
88 concepts mapped · 88 in the Library
Accumulation/Distribution Line FAQ
Turn Accumulation/Distribution Line into a trading strategy.
Take the implementation from this page into Quant, then build on it, backtest it on real data, and keep refining it in conversation.