ACD Method
 By LuxAlgoOct 9, 2026
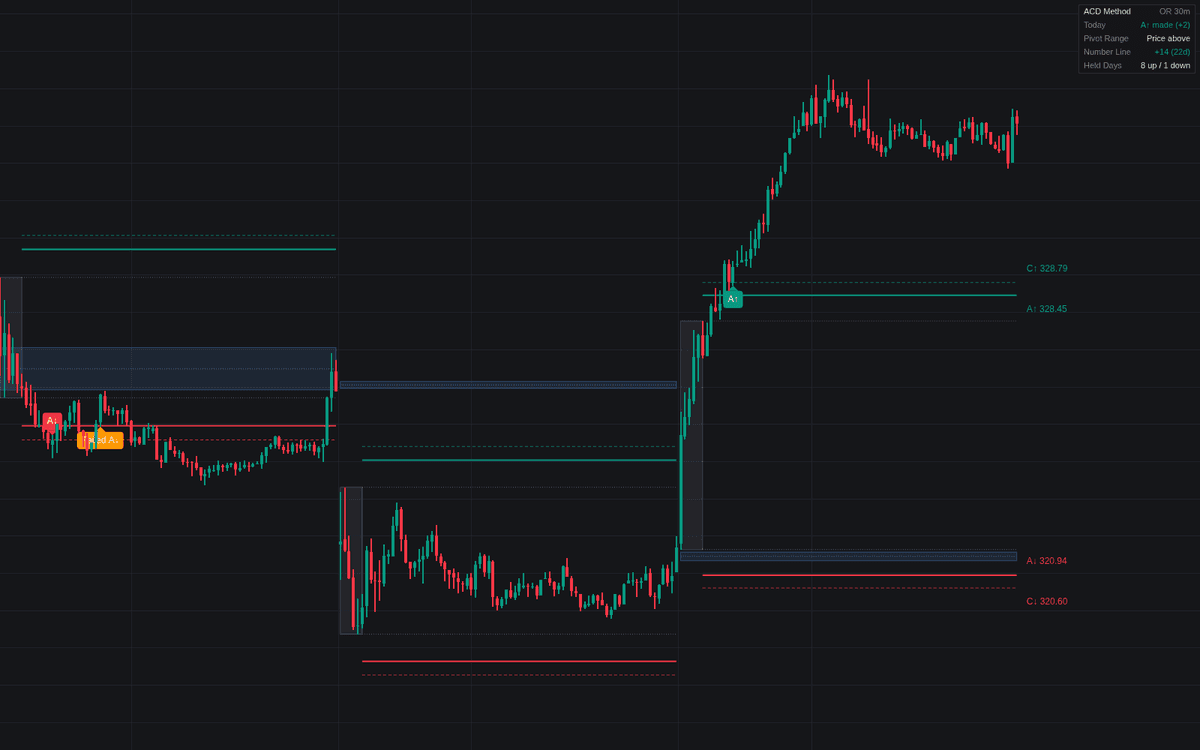

ACD Method is a systematic framework that implements the classic opening range breakout methodology to help traders identify directional trends and potential reversal points. By establishing an opening range and calculating dynamic A and C levels based on the Average Daily Range, the indicator provides objective entry and exit criteria. It serves as a tool to measure market conviction during the opening phase and track momentum as price interacts with these statistically derived levels, allowing for more disciplined execution within the session context.
How to Trade the ACD Method?
The indicator begins by defining an opening range for your chosen market session. Once this time window expires, the indicator establishes A-levels, which serve as the initial breakout points. A signal occurs when price closes beyond these levels and maintains that position according to your configured time rule.
If an A-level is breached but price subsequently fails and returns inside the opening range, this indicates a potential trap. A failed A-level sets the stage for a C-level trade, which acts as a reversal signal. By waiting for the C-level, traders aim to capture the movement against those who were trapped by the initial breakout. The pivot range offers additional context, helping you judge whether a signal is supported by the broader session structure or is running into potential resistance. The number line provides a cumulative score for recent sessions, giving you a quick view of the developing daily trend.
ACD Method Settings
Session & Opening Range
- Regular Session: Defines the time window for the opening range calculation.
- Timezone: Ensures the session timing aligns with the exchange where your instrument is listed.
- Opening Range (minutes): Sets the duration for the opening period to build the initial base.
- Time Rule: Specifies how long the price must stay beyond a level for a signal to be confirmed.
A & C Levels
- A Value: The distance from the opening range used to establish A-levels, scaled by the average daily range.
- C Value: The multiplier for determining C-levels, typically wider than A-levels to account for reversal volatility.
- ADR Length: Defines the number of completed sessions used to calculate the average daily range for level scaling.
Pivot Range
- Pivot Range Sessions: The lookback period for calculating the pivot levels.
- Show Pivot Range: Toggles the visualization of the pivot and midpoint bands for contextual analysis.
Display & Dashboard
- Number Line Sessions: The number of past sessions to include in the rolling trend score calculation.
- Keep: Limits how many historical sessions remain visible on your chart.
- Show Dashboard: Enables the summary table that displays current levels, signal states, and the session score.
Frequently Asked Questions
Free on Vela
Run it on Vela. Go further with a paid plan.
- Up to 500 strategy alerts, with webhook automation
- Up to 10× the chart history of Free
- Orderflow lookback up to full history
- Up to 100,000 monthly credits for Quant to customize it
- Futures data alongside crypto, stocks, forex and commodities

Run it on Vela. Make it yours with Quant.
Open this indicator free on Vela, our next-generation charting platform. Then ask Quant, our coding agent built into Vela, to retune it or turn it into a backtested strategy of your own.