ACD Method
ACD Method, also known as ACD, ACD system, Logical Trader method, A and C levels, is a Time, Sessions & Seasonality concept. The Library holds 1 implementation, a working definition you can pull into Quant.
Top ACD Method indicator
The top custom implementation, built on the original standard ACD Method formula.
1 total
The ACD Method implementation below can become a backtested trading strategy — describe your rules and Quant writes the code.
What is the ACD Method?
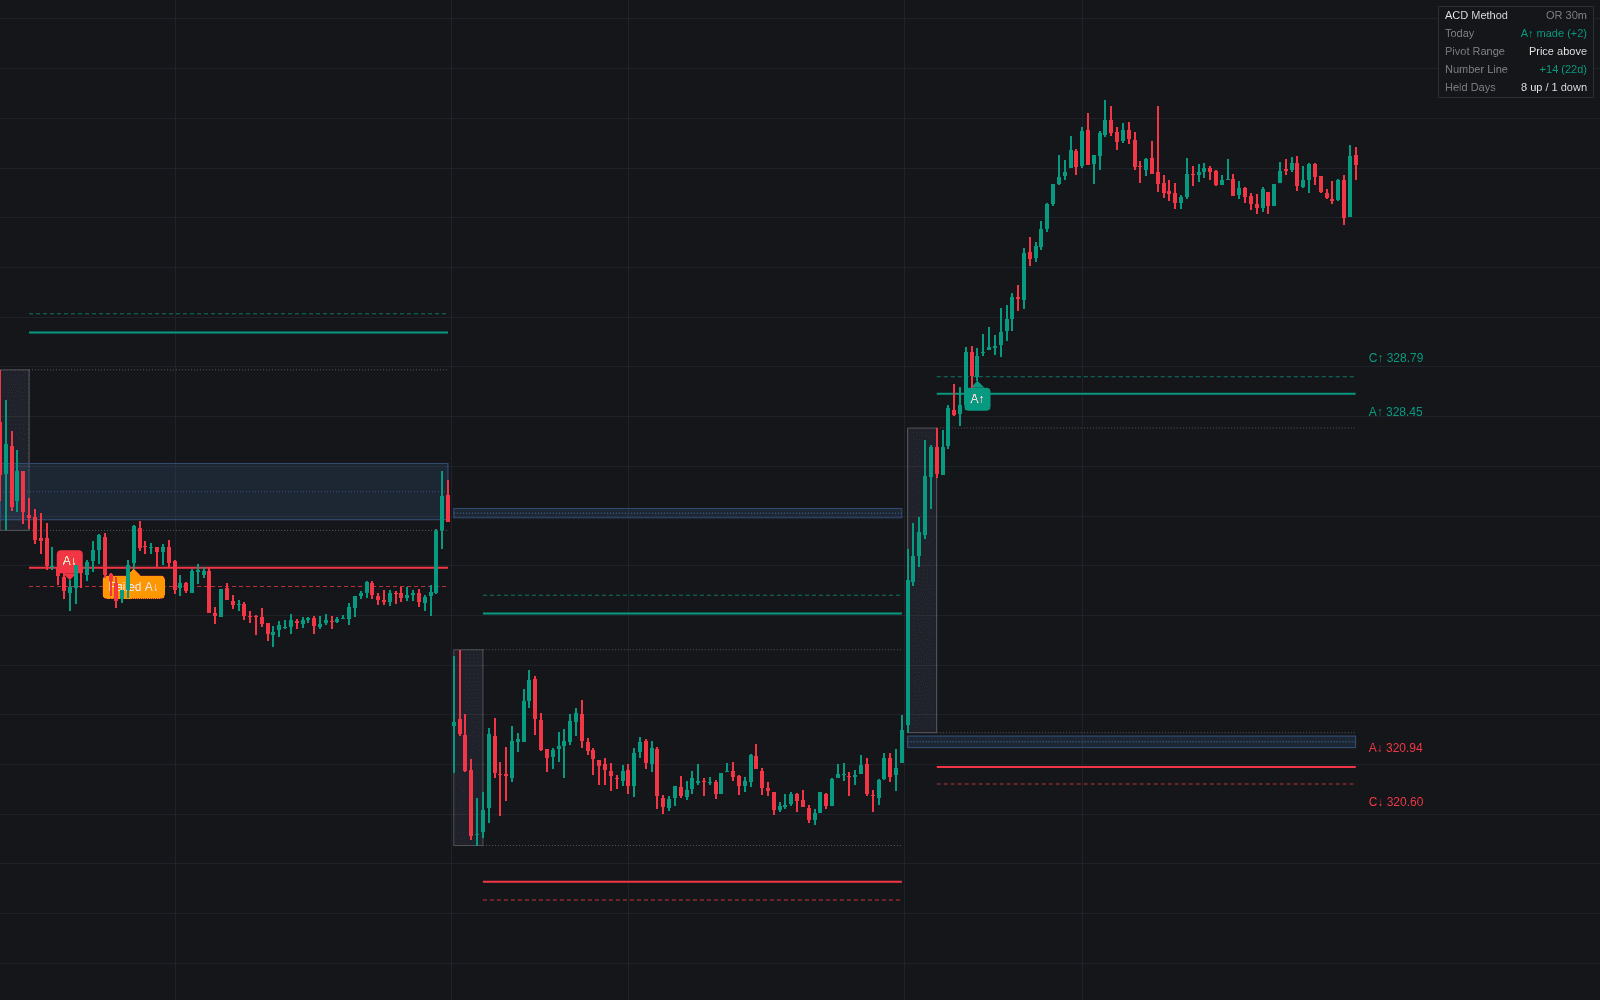
The ACD method is the opening-range system Mark B. Fisher set out in The Logical Trader: Applying a Method to the Madness (Wiley, 2002), built on A and C levels offset from the opening range and a pivot range from the prior session. It starts from the opening range, the high and low of a fixed window after the open whose length Fisher set per market. An A up sits a set distance, the A value, above the opening range high, and an A down the same distance below the low; reaching and holding an A level is the method's directional entry.
C levels sit farther out and handle the opposite case. When an A in one direction fails and price instead drives through the other side of the opening range by the C value, the C (a C down after a failed A up, for example) is the signal to reverse, because traders who acted on the A are now trapped. A time rule filters both: price must hold beyond a level for a set period, commonly cited as half the opening-range window, before the signal counts. The A and C values are set per instrument and scale with its volatility.
Fisher pairs the levels with a pivot range from the prior session: the pivot, (high + low + close) / 3, and the midpoint, (high + low) / 2, define a band centered on the pivot, the same arithmetic later popularized as the central pivot range. Where price trades relative to that band sets the day's context, and rolling multi-day versions extend it. Fisher also scores each day's outcome and keeps a rolling 30-day sum, the number line, as a gauge of the developing trend.
How it's calculated
Signal levels offset from the session's opening range, plus a pivot range from the prior session.
Fisher calibrated the opening window and both offsets per market.
The pivot range runs from M to its mirror image around P; which edge is on top depends on whether the prior close finished above or below the midpoint.
Rolling pivot ranges apply the same formulas to the high, low and close of the last several sessions.
How traders use it
- Directional day trades: enter on a valid A in either direction, and treat a return into the opening range as the sign that the A has failed.
- Reversals: a failed A followed by a C on the opposite side is the method's stop-and-reverse, a codified way of trading a false breakout of the opening range.
- Context filtering: an A up from above the pivot range is typically read as aligned with the day's context, while an A up that runs into the pivot range from below is treated with suspicion, and the reverse for A downs.
- Multi-day bias: the number line and rolling pivot ranges carry the read across sessions, and some practitioners apply the same logic to weeks or months, using the first day or first week as the opening range.
- Honest limits: the published calibrations came from exchange-traded futures, so the window, offsets and time rule need testing on any other market, including a chosen session open on forex or crypto, and like every opening-range method ACD struggles on rotational days.
ACD vs related opening-range tools
Opening Range & ORB: A plain opening range breakout trades the first break of the range. ACD demands a buffer (the A value) and a time hold before acting, and adds a defined reversal level for when that break fails.
Central Pivot Range: The CPR uses the same three-price band as Fisher's pivot range, later popularized under its own name with an emphasis on width analysis. In ACD the band is context for opening-range signals rather than a standalone tool.
Initial Balance: Market Profile's initial balance is the first hour's range, used to classify day types by how far the session extends beyond it. ACD's window is market-specific, and its levels are fixed offsets that trigger trades.
Concept family
Time, Sessions & Seasonality
32 concepts mapped · 32 in the Library
ACD Method FAQ
Turn ACD Method into a trading strategy.
Take the implementation from this page into Quant, then build on it, backtest it on real data, and keep refining it in conversation.