Anchored VWAP
 By LuxAlgoApr 13, 2020
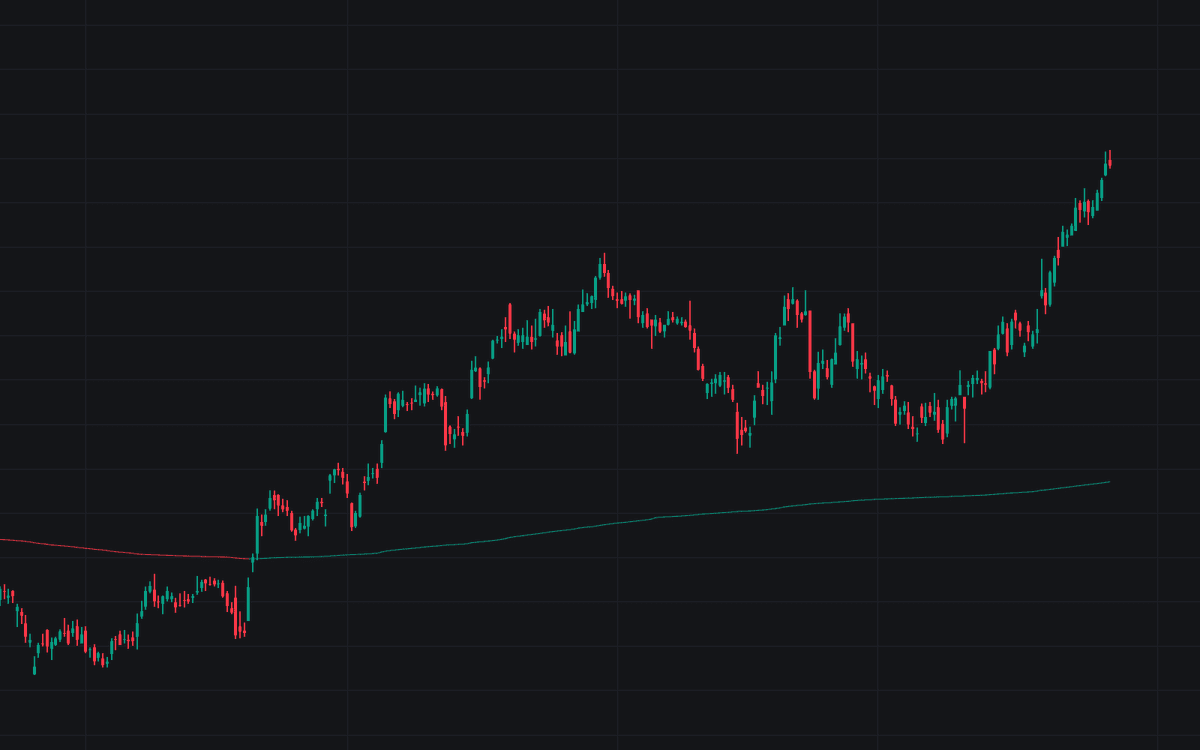

The Anchored VWAP plots the volume-weighted average price accumulated from a bar you choose rather than from an automatic session reset, so the line tracks the average cost of all trading since a chosen event: an earnings release, a swing low, a breakout bar. Optional bands place standard deviations around the average to frame stretch. A standard implementation: one anchor, one line, optional bands.
How to Trade the Anchored VWAP?
- Price above a rising AVWAP from a major low: buyers since that low hold, on average, winning positions. Pullbacks into the line attract dip buyers.
- Price below a falling AVWAP from a major high: the average buyer since the anchor is losing money. Rallies into it often stall as those positions exit near breakeven.
- Cross of the AVWAP: the close moving through the line flips which side of the average cost price trades on, weightiest at widely watched anchors.
- Band touches (Bands enabled): a reach to the Upper or Lower Band marks a full multiple of standard deviations from the mean, context for fades or trailing exits.
The line is a reference, not a barrier: price crosses anchored averages routinely, so treat a touch as a place to evaluate rather than a signal. Alert conditions Price Crossed Above AVWAP and Price Crossed Below AVWAP cover the cross in both directions.
Anchored VWAP Settings
- Anchor time (default 01 Jan 2024): where accumulation begins, set by clicking a chart bar when the indicator is added; the line never resets on its own. Reposition the anchor to restart it.
- Source (default hlc3): the price being volume-weighted; close aligns the line with close-based tools.
- Bands (default disabled): draws standard deviation bands around the AVWAP with a soft fill between them.
- Multiplier (default 2.0): standard deviations for the bands. Higher isolates rare extensions, lower gives frequent, weaker touches.
Frequently Asked Questions

The Library is free. Quant makes it yours.
Pull any concept or indicator into Quant: rebuild it, retune it, or turn it into a backtested strategy of your own.