Concept
Anchored VWAP
Anchored VWAP is a Volume & Order Flow concept. The Library holds 2 implementations, each one a working definition you can pull into Quant.
swing/high/low/earnings/IPO/custom anchor
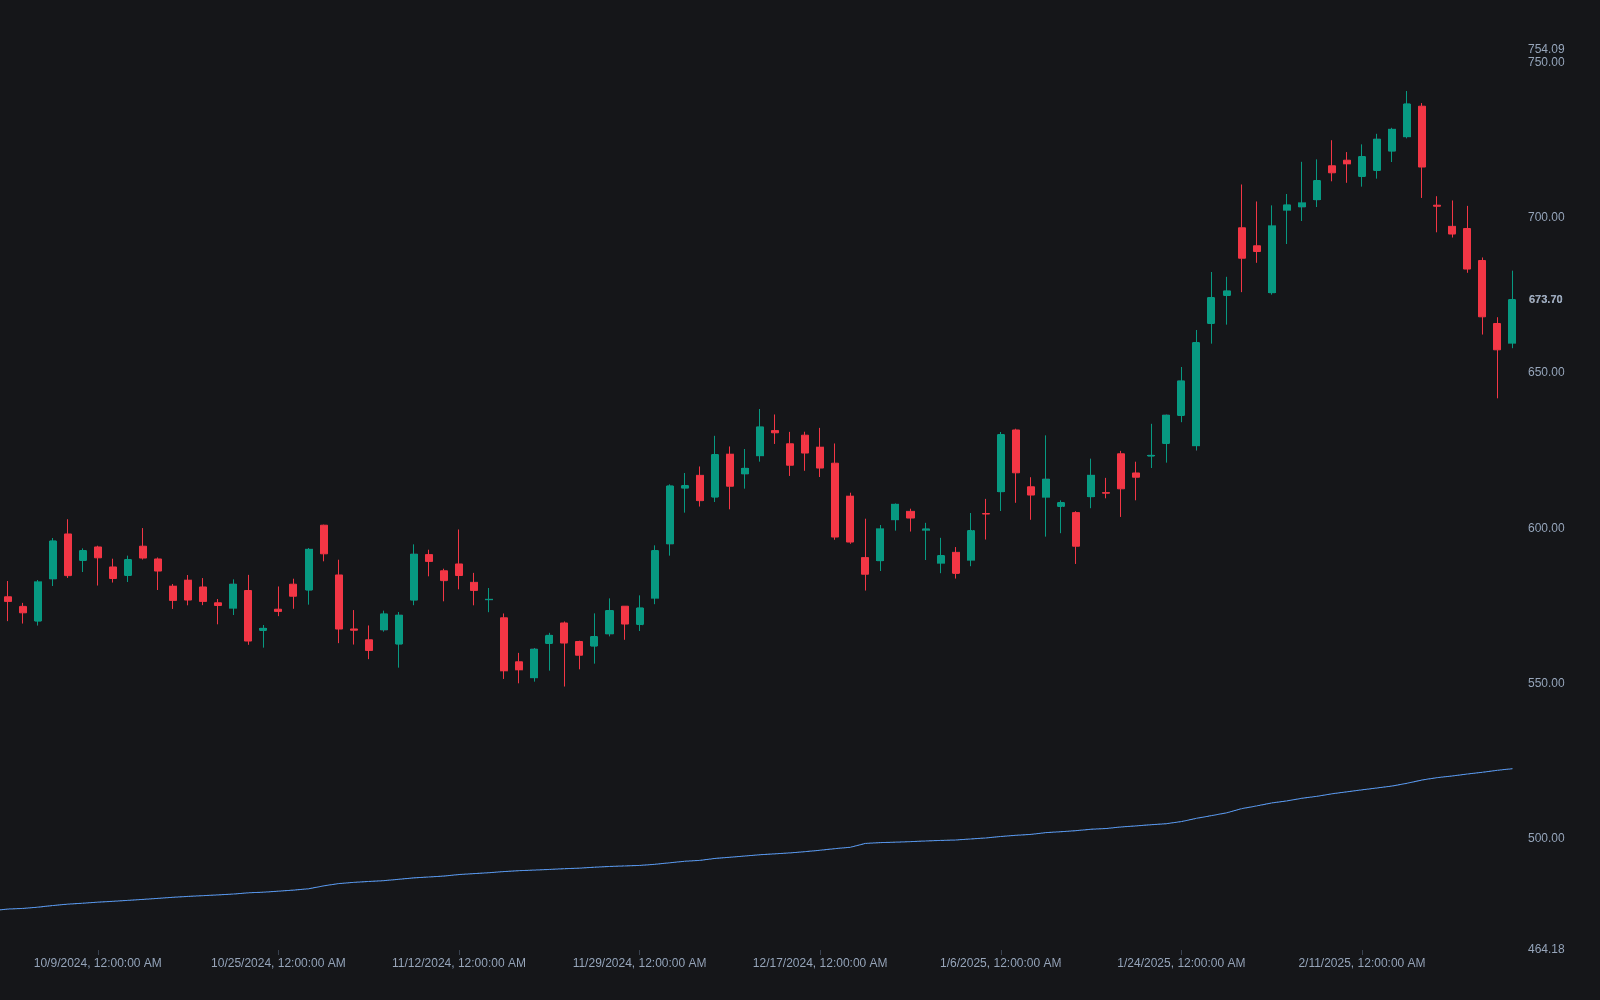
Top Anchored VWAP indicator
The top custom implementation, built on the original standard Anchored VWAP formula.
2 total
Every Anchored VWAP implementation here is strategy-ready: open one in Quant, set your rules, and it backtests automatically.
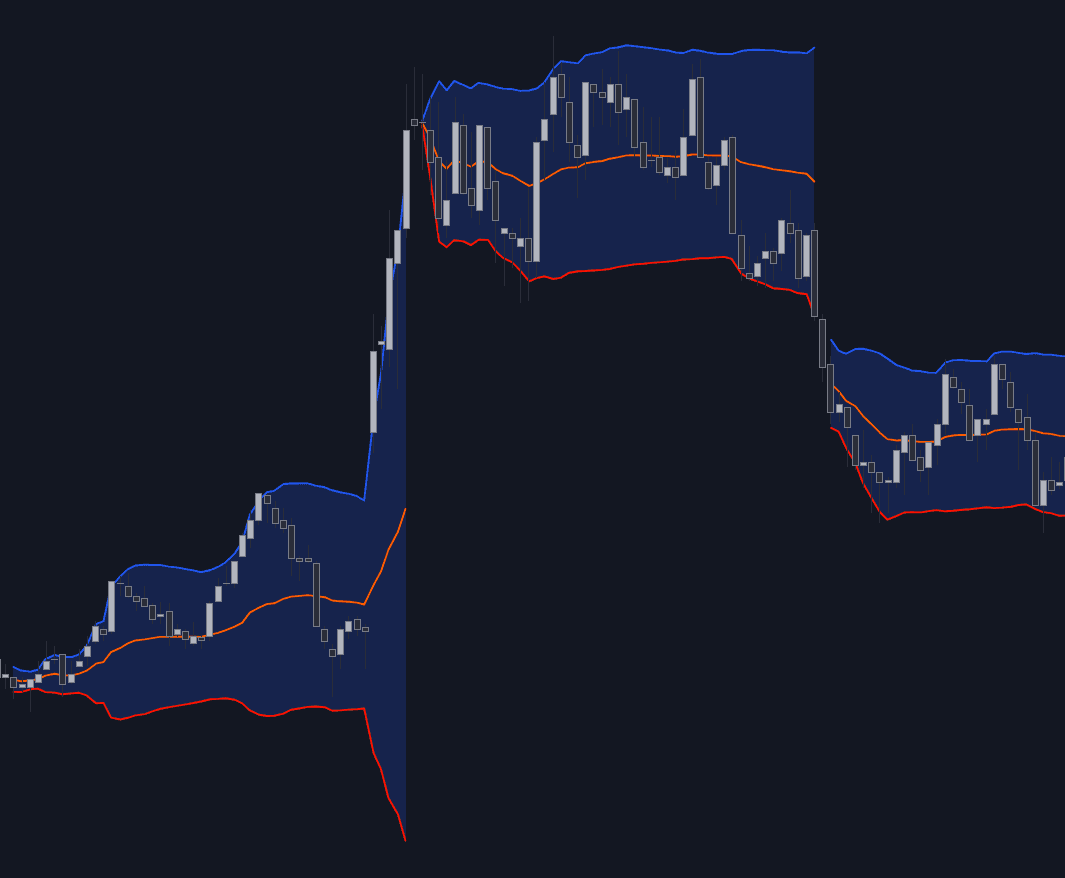
The standard Anchored VWAP indicator
Anchored VWAP exactly as classically defined: the faithful reference build of the original formula, free to run in Quant.
What is Anchored VWAP?
Anchored VWAP (AVWAP) is a volume-weighted average price whose calculation starts at a bar you choose rather than at an automatic boundary such as the session open. From the anchor forward, each bar's typical price is multiplied by its volume, accumulated, and divided by cumulative volume, so the line approximates the average price paid per unit traded since that event. Popular anchors include major swing highs and lows, earnings gaps, IPO opening prints, breakout bars, and high-volume news candles. The idea descends from Paul Levine's mid-1990s MIDAS studies, which projected volume-weighted average price curves from trader-chosen anchor points.
Reading the line is a positioning exercise. When price trades above a rising AVWAP taken from a significant low, the average participant since that low is in profit, which tends to make dip-buying self-reinforcing; below a falling one, average holders since the anchor are underwater. Because the line represents real average cost rather than a pattern, traders treat it as a level in its own right, expecting reactions where profitable or trapped inventory reconsiders.
It matters because it converts VWAP from a calendar benchmark into an event benchmark: the question shifts from "what is the average price since the open?" to "what has the average participant paid since the event that mattered?". Still, the line is an average, not a wall. Price cuts through anchored VWAPs regularly, so touches are places to evaluate a trade, and the anchor choice itself is a discretionary call two traders will make differently.
How to calculate Anchored VWAP
The arithmetic is ordinary VWAP; the judgment is all in the anchor.
- 1Pick the anchor bar: a swing high or low, an earnings or news gap, an IPO's first bar, or the start of a high-volume move. The anchor should mark an event that plausibly reset positioning.
- 2From the anchor forward, accumulate typical price (commonly (high + low + close) / 3, sometimes just the close) multiplied by volume, and separately accumulate volume.
- 3Divide the running price-volume sum by the running volume sum on every bar and plot the result. The line begins at the anchor and extends right indefinitely.
- 4Read slope and side: price holding above a rising line is constructive since the event. Note that old anchors move sluggishly, because each new bar is a small fraction of the accumulated volume.
How it's calculated
The volume-weighted average price of all trading since a user-chosen anchor bar, updated cumulatively with each new bar.
Session VWAP is the special case anchored at the session open.
Close or the average of open, high, low, and close are common source alternatives to typical price.
The sums never reset on a schedule; moving the anchor is the only way to restart the line.
How traders use it
- As event-based support and resistance: a pullback to an AVWAP taken from a breakout bar or a major low gives a defined area to trade against, with invalidation if price accepts beyond the line.
- As a trend-health gauge: an uptrend that keeps closing above the AVWAP anchored at its origin is retaining its average buyer; losing that line warns that the move's sponsorship is eroding.
- As confluence mapping: anchoring from both the last major high and the last major low brackets price between two cost bases, and places where several anchors converge with other S/R zones are typically given more weight than any single line.
- As a bias frame around scheduled events: an AVWAP from an earnings bar shows whether the average post-earnings participant is in profit, which frames continuation versus fade scenarios in the weeks after the report.
Anchored VWAP vs other VWAP variants
Session VWAP: Session VWAP anchors automatically at every session open and ends at the close. Anchored VWAP starts wherever you decide and runs indefinitely, so it answers event-specific questions a session reset cannot.
Rolling VWAP: Rolling VWAP volume-weights a fixed sliding window of recent bars, dropping old data as it advances. An anchored VWAP never drops data; every bar since the anchor keeps its weight in the average.
Periodic VWAPs: Periodic VWAPs re-anchor mechanically at calendar boundaries such as the week, month, quarter, or year. Anchored VWAP trades that regularity for judgment: the anchor is an event you consider significant, not a date.
VWMA: A volume-weighted moving average weights only the last N bars and slides forward like any moving average. Anchored VWAP is cumulative from a fixed point, so as the moving window leaves the anchor behind, the two can separate widely.
Concept family
Volume & Order Flow
88 concepts mapped · 88 in the Library
Anchored VWAP FAQ
Turn Anchored VWAP into a trading strategy.
Take any implementation from this page into Quant, then build on it, backtest it on real data, and keep refining it in conversation.