ATH/ATL Tracker
 By LuxAlgoJun 6, 2024
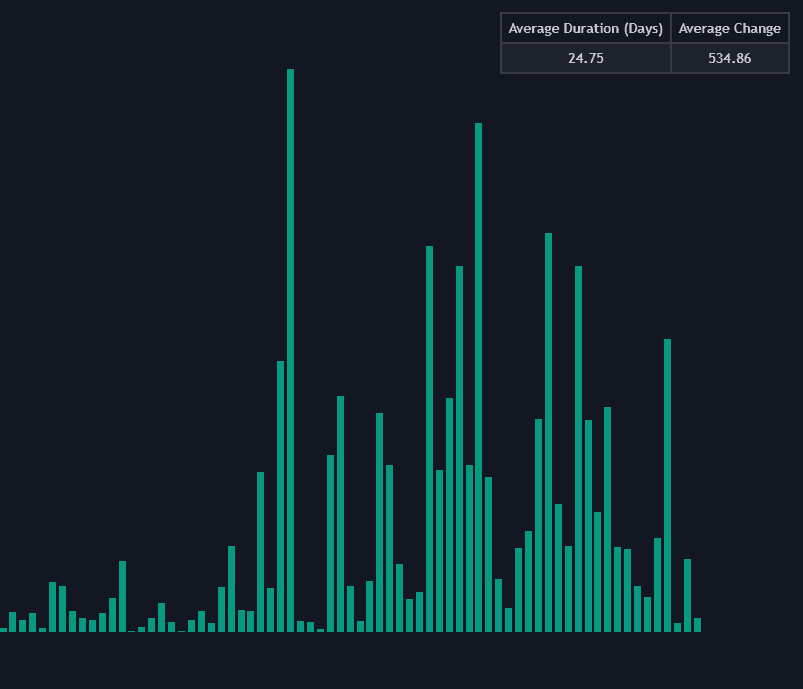
ATH/ATL Tracker charts how far every new all-time high or all-time low traveled beyond the previous one, across the instrument's entire available history, as a histogram. Tooltips log the price and date of each record, and a dashboard averages the gaps: how long record extremes take to form and how large the moves between them run.
How to Trade the ATH/ATL Tracker?
- Tall bars: the biggest jumps between successive records stand out instantly, flagging the market's most explosive record-setting phases.
- Record frequency: a swelling count of fresh highs reflects confidence and willingness to pay elevated prices; thinning records warn of fading momentum or growing caution.
- Dashboard averages: Average Duration estimates how long the market typically waits between records, while Average Change sizes the typical move: base rates for anticipating the next one.
The tracker filters trivial records by referencing a higher timeframe: on a 1-minute chart, five consecutive new highs collapse into the single true ATH when validated against a 5-minute duration, and the tool warns you if the selected timeframe is suboptimal. Watching which sectors keep printing records is a quick leaders-versus-laggards check, in the spirit of the library's breadth and sentiment tools.
ATH/ATL Tracker Settings
- Duration: the higher timeframe used to validate meaningful ATHs and ATLs.
- Order: chronological or reverse-chronological bar layout.
- Bar Width / Bar Spacing: sizing and separation of the histogram bars.
- Dashboard Settings: size and placement of the averages panel.
Frequently Asked Questions
Free indicator
Get free access to this indicator on the platforms below.

The Library is free. Quant makes it yours.
Pull any concept or indicator into Quant: rebuild it, retune it, or turn it into a backtested strategy of your own.