Average Directional Index
 By LuxAlgoApr 13, 2020
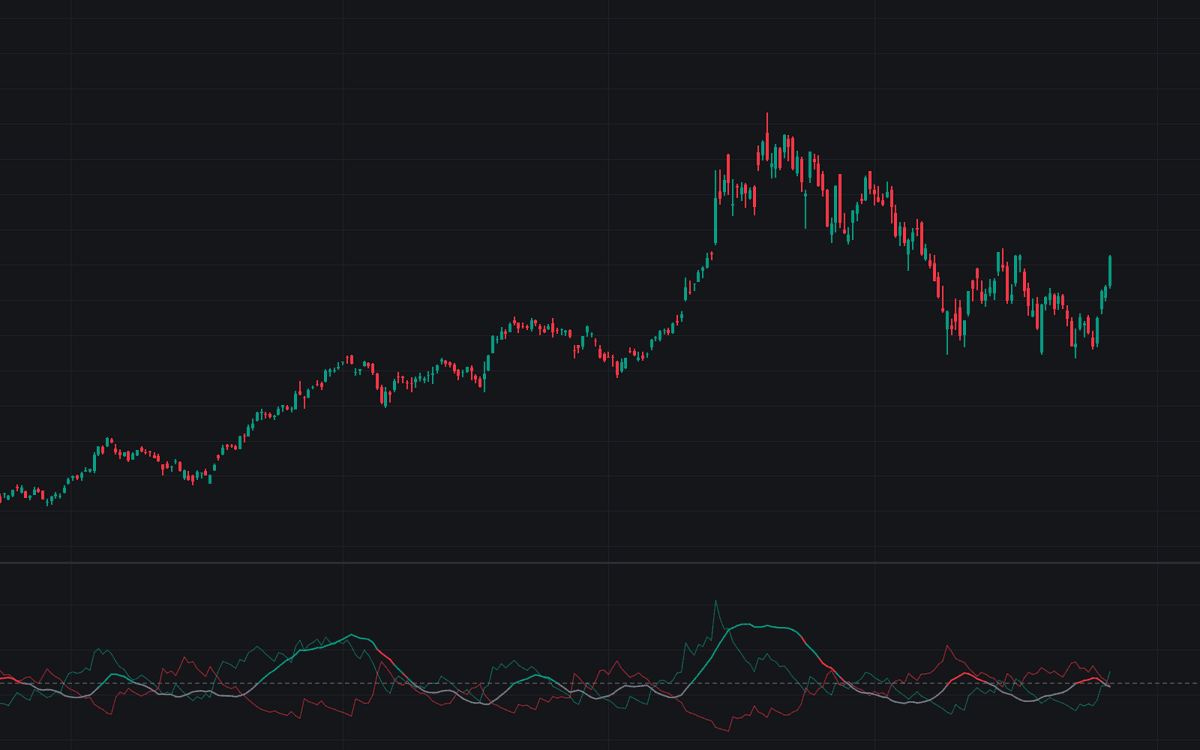

The Average Directional Index splits trend analysis into two questions: is this market trending at all, and in which direction? The build plots the full Wilder system: +DI and -DI express upward and downward movement relative to true range, while the ADX line smooths their difference into a pure strength gauge. A dashed Key Level marks the trend-strength threshold. Defaults follow Wilder's originals, 14-period smoothing at both stages, the unmodified standard calculation.
How to Trade the Average Directional Index?
- ADX above the Key Level (default 25): one side is dominating persistently. Trend-following entries and breakout continuation carry more weight.
- ADX below the Key Level: no durable dominance; range tactics apply and DI crossovers deserve heavy discounting.
- +DI above -DI: up-moves dominate. Direction is up while it holds; a DI cross while ADX rises is the classic entry configuration.
- ADX rolling over from a high reading: dominance fading. Contraction, not reversal; price often drifts rather than turns when ADX dies.
ADX climbs in persistent declines just as in persistent advances; the DI lines, not ADX, carry direction. Three alert conditions are included: Bullish DI Cross, Bearish DI Cross, and ADX Above Key Level.
Average Directional Index Settings
- DI Length (default 14): Wilder RMA smoothing applied to directional movement and true range for +DI and -DI. Shorter flips the DI lines faster and multiplies crossovers; longer cuts whipsaw but delays direction changes.
- ADX Smoothing (default 14): the second smoothing pass, from DX to the ADX line. Lower registers regime changes sooner at the cost of chop.
- Key Level (default 25): the dashed reference ADX is read against. Toward 30 restricts "trending" to stronger markets; toward 20 flags regimes earlier with more false positives.
Frequently Asked Questions

The Library is free. Quant makes it yours.
Pull any concept or indicator into Quant: rebuild it, retune it, or turn it into a backtested strategy of your own.