Concept
ADX / DMI System
ADX / DMI System, also known as +DI/−DI, ADXR, Commodity Selection Index, is a Trend concept. The Library holds 1 implementation, a working definition you can pull into Quant.
The standard ADX / DMI System indicator
ADX / DMI System exactly as classically defined: the faithful reference build of the original formula, free to run in Quant.
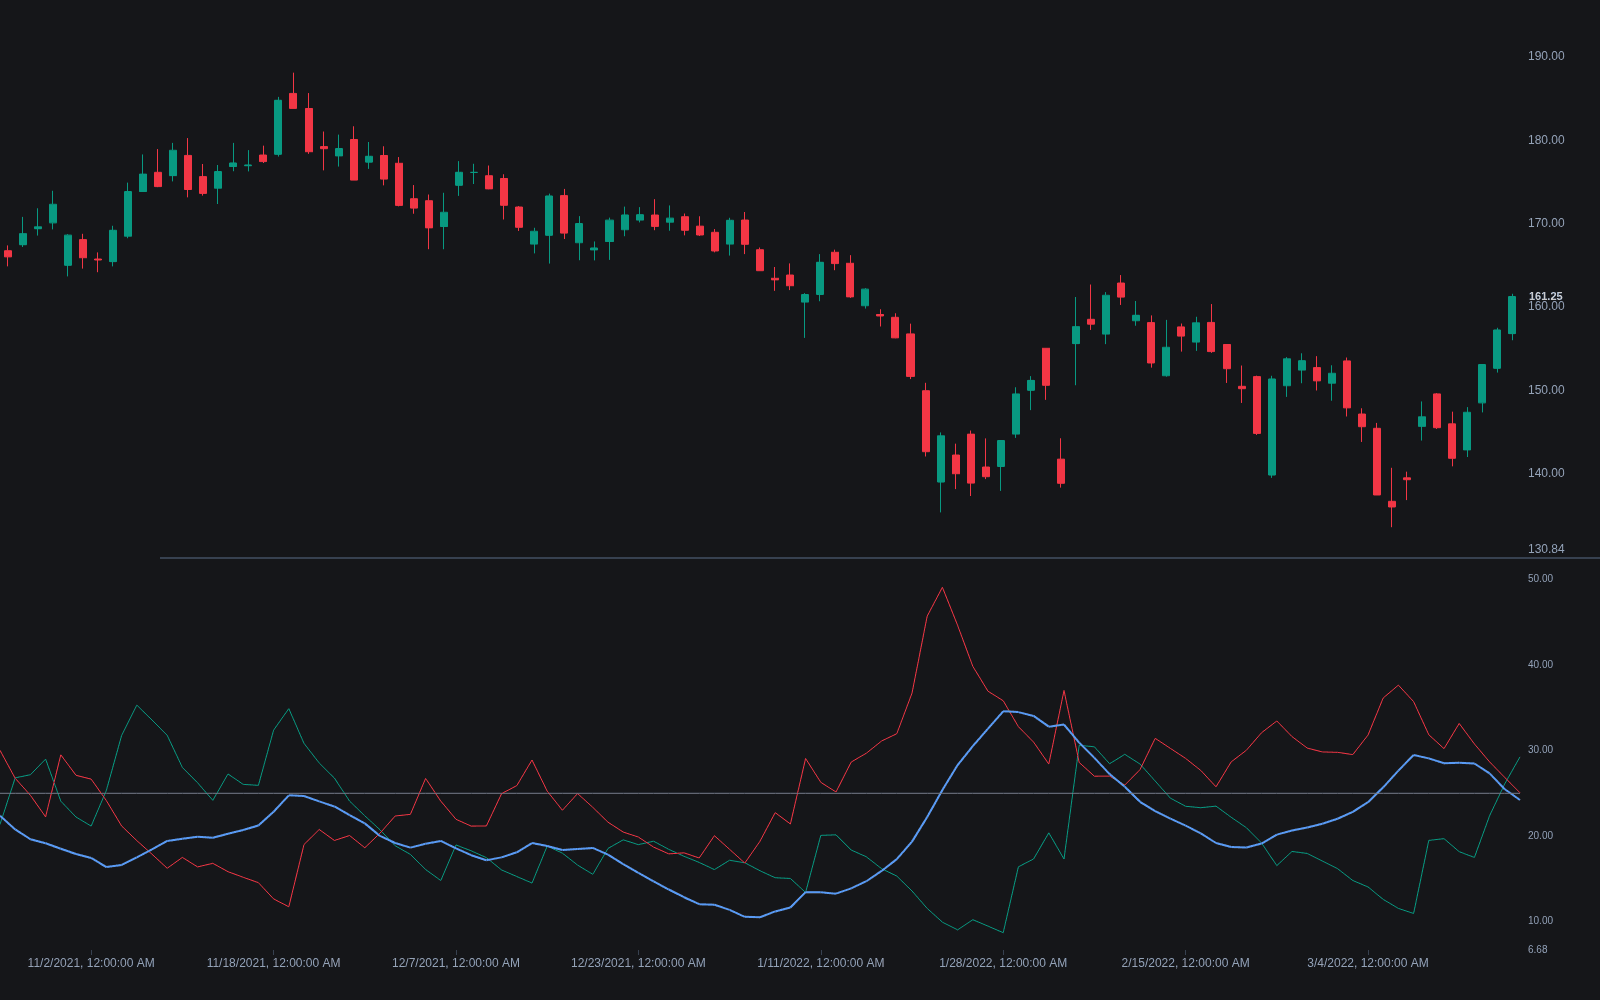
What is the ADX / DMI System?
The ADX / DMI System is J. Welles Wilder's directional movement framework, published in his 1978 book New Concepts in Technical Trading Systems. Each bar contributes an up-move (its high minus the prior high) and a down-move (the prior low minus its low); only the larger of the two counts, and only when positive, becoming +DM or −DM. Both series are smoothed (Wilder's recursive average, today's RMA, over 14 periods by default) and divided by the smoothed true range, giving +DI and −DI: the share of range that is directional, expressed as percentages.
Direction and strength are then separated. The DI lines carry direction: +DI above −DI means up-moves dominate. Strength comes from DX, the absolute difference between the DI lines divided by their sum, times 100; the ADX is a smoothed DX. ADX is therefore direction-blind. It rises whenever one side dominates persistently, in downtrends as readily as uptrends, and falls when neither side keeps the upper hand.
The system matters because the question of whether a market is trending at all gates almost everything else in technical analysis, and ADX remains the default answer. It feeds trend/range classifiers and regime filters that switch playbooks between trend-following and mean reversion. Its known cost is lag: two rounds of smoothing mean ADX confirms trends after they are underway and flags their death after the range has already begun.
How to calculate the ADX / DMI System
The calculation runs in three stages: directional movement, DI normalization, then strength.
- 1For each bar, compute the up-move (high minus prior high) and down-move (prior low minus current low). If the up-move is larger and positive, +DM equals it and −DM is zero; if the down-move is larger and positive, the reverse. If neither is positive, both are zero.
- 2Smooth +DM, −DM, and true range over the lookback (Wilder's default is 14 with his recursive smoothing). +DI is 100 times smoothed +DM divided by smoothed true range; −DI is the same for −DM.
- 3Compute DX as 100 times the absolute value of +DI minus −DI, divided by their sum. Smooth DX the same way to get ADX. ADXR, where used, averages the current ADX with the ADX from 14 bars earlier.
- 4Read it in two parts: the DI lines for direction, the ADX level and slope for strength. Common conventions treat a rising ADX above roughly 20 to 25 as trending conditions and readings below 20 as weak or absent trend.
How it's calculated
ADX measures trend strength from the smoothed balance of upward (+DI) and downward (-DI) directional movement, independent of trend direction.
All smoothing is Wilder's RMA, equivalent to an EMA with alpha = 1/n; substituting a plain EMA or SMA changes the values.
ADX carries no direction; the trend side is read from whether +DI or -DI is on top, and 25 is a common strength threshold.
Wilder's Commodity Selection Index ranks markets by combining ADXR with ATR and contract cost terms.
How traders use it
- As a regime gate: trend entries such as breakouts are enabled only while ADX is above a threshold and rising, while a low, falling ADX shifts the playbook toward range tactics and mean reversion.
- As Wilder's original signal system: long when +DI crosses above −DI, short on the reverse, with his extreme point rule (enter only when price passes the crossover bar's high or low) filtering some of the whipsaw.
- As an exhaustion tell: an ADX peaking at a high level and rolling over is commonly read as trend exhaustion risk, prompting tightened stops or profit-taking rather than fresh entries in the trend's direction.
- As a screening tool: ranking instruments by ADX or ADXR surfaces markets worth trend-trading; Wilder's Commodity Selection Index formalized this by combining ADXR with volatility to allocate attention across markets.
ADX / DMI vs other trend-strength measures
Aroon: Both ask whether a trend exists. Aroon measures how recently the highest high and lowest low printed, a purely time-based read, while ADX measures how much of the smoothed range is directional.
Vortex: The Vortex lines resemble DI lines: range-normalized directional movement that crosses to signal direction. Vortex measures the distance from each high to the prior bar's low and from each low to the prior bar's high, and omits the separate smoothed strength line that makes ADX distinctive.
Kaufman Efficiency Ratio: The ER divides net price change by the sum of absolute bar-to-bar changes, a fast-reacting path-efficiency measure bounded between 0 and 1. ADX instead measures persistent one-sided dominance and reacts slowly because of its double smoothing.
Choppiness Index: Choppiness measures how much price folded back on itself inside its range, with high readings meaning congestion, the opposite polarity of ADX. Both are direction-blind, but one reads range structure and the other directional dominance.
Concept family
Trend
100 concepts mapped · 100 in the Library
ADX / DMI System FAQ
Turn ADX / DMI System into a trading strategy.
Take the implementation from this page into Quant, then build on it, backtest it on real data, and keep refining it in conversation.