Bar Counting H1/H2
 By LuxAlgoOct 9, 2026
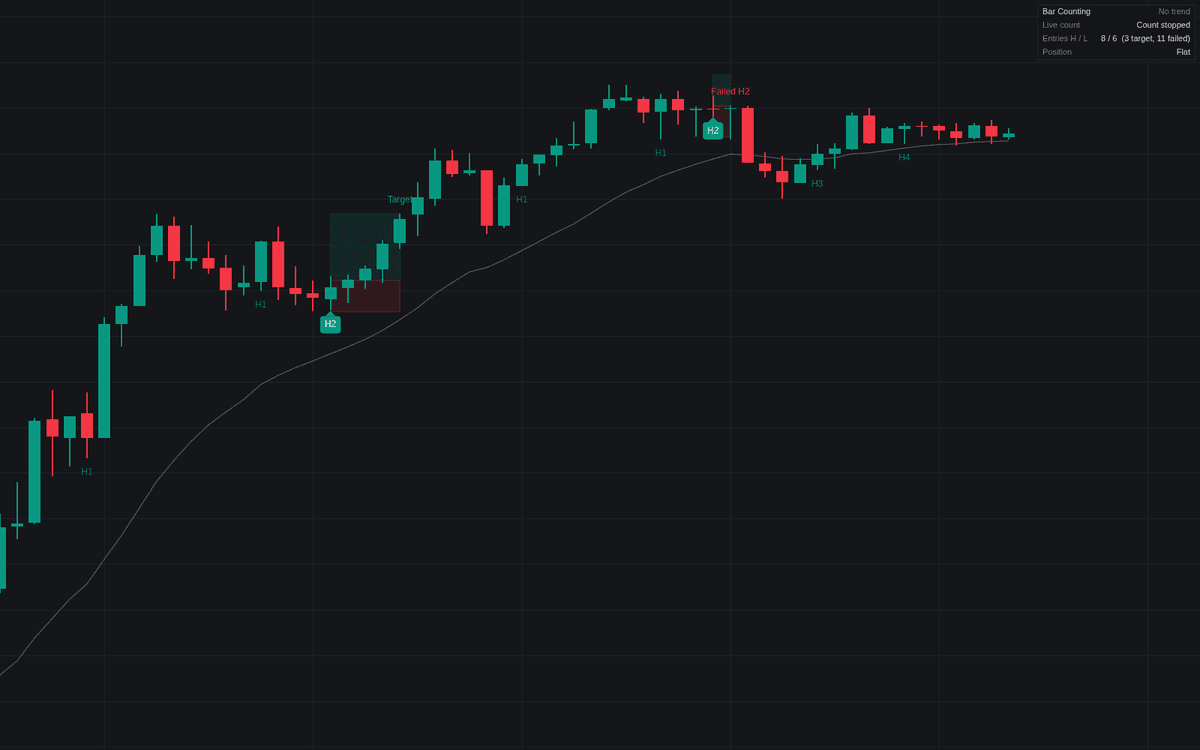

The Bar Counting H1/H2 indicator provides a disciplined framework for identifying pullbacks within strong directional trends. By systematically tracking the sequence of price movements against a primary trend, the tool highlights objective entry points known as High (H) and Low (L) counts. This approach helps traders filter out market noise and focus on higher-probability setups, providing clear labels for entry signals, protective stop placements, and profit targets. It serves as an essential utility for those who rely on classic price action patterns to time their entries during active market phases.
How to Trade the Bar Counting H1/H2?
Trading with this indicator relies on the principle of counting pullbacks against an established exponential moving average (EMA). In a bullish trend, the indicator looks for pullbacks and labels them as H1, H2, and so on. An H1 represents the first attempt to resume the uptrend after a pullback, while an H2 signifies the second attempt.
To trade effectively, look for the following:
- Signal Identification: Prioritize setups that align with the slope of the EMA. A rising EMA confirms a bullish bias, while a falling EMA confirms a bearish bias.
- Entry Timing: The indicator identifies H1 and H2 or L1 and L2 setups. While first attempts can work in very strong trends, second attempts (H2/L2) are often preferred as they confirm a two-legged pullback has completed.
- Risk Management: The indicator provides two methods for stop placement: placing the stop just beyond the signal bar or behind the extreme of the entire pullback. Using the pullback extreme offers a wider safety margin but requires a smaller position size.
- Profit Taking: You may target the previous trend extreme for a test of momentum or use a fixed risk multiple (R-Multiple) to ensure a consistent reward-to-risk ratio. The built-in dashboard helps monitor open trades and historical performance metrics.
Bar Counting H1/H2 Settings
Trend Context
- Moving Average Length: Sets the period for the EMA used to define the trend direction and context for counts.
- Trend Extreme Lookback: Determines the number of bars used to calculate new highs or lows for trend tracking.
Count
- Maximum Count: Defines the upper limit for the counting sequence before the pullback is considered too deep to be part of the current trend.
- Show Every Count: Toggles the visibility of all count labels versus only those that meet the criteria for a traded setup.
Trade Plan
- Trade: Selects which setups to signal, such as only second entries (H2/L2) or both first and second entries.
- Protective Stop: Chooses the stop loss logic, either based on the signal bar alone or the absolute extreme of the pullback.
- Target: Sets the method for profit calculation, either targeting the previous trend extreme or a specific R-multiple.
- Minimum Reward / R Multiple (R): Acts as a floor for the target price or the fixed target ratio.
- Maximum Hold (Bars): Sets the maximum duration for a trade; if the target is not reached within this timeframe, the trade is closed.
Dashboard
- Show Dashboard: Toggles the display of the live market context table.
- Position: Controls where the dashboard is anchored on the screen.
- Size: Adjusts the scale of the dashboard text.
Style
- Show Moving Average: Toggles the visibility of the EMA line on the chart.
- Bull / Bear / Average: Allows customization of the colors used for the count labels, dashboard, and the EMA line.
Frequently Asked Questions
Free on Vela
Run it on Vela. Go further with a paid plan.
- Up to 500 strategy alerts, with webhook automation
- Up to 10× the chart history of Free
- Orderflow lookback up to full history
- Up to 100,000 monthly credits for Quant to customize it
- Futures data alongside crypto, stocks, forex and commodities

Run it on Vela. Make it yours with Quant.
Open this indicator free on Vela, our next-generation charting platform. Then ask Quant, our coding agent built into Vela, to retune it or turn it into a backtested strategy of your own.