Bollinger Bands
 By LuxAlgoApr 13, 2020
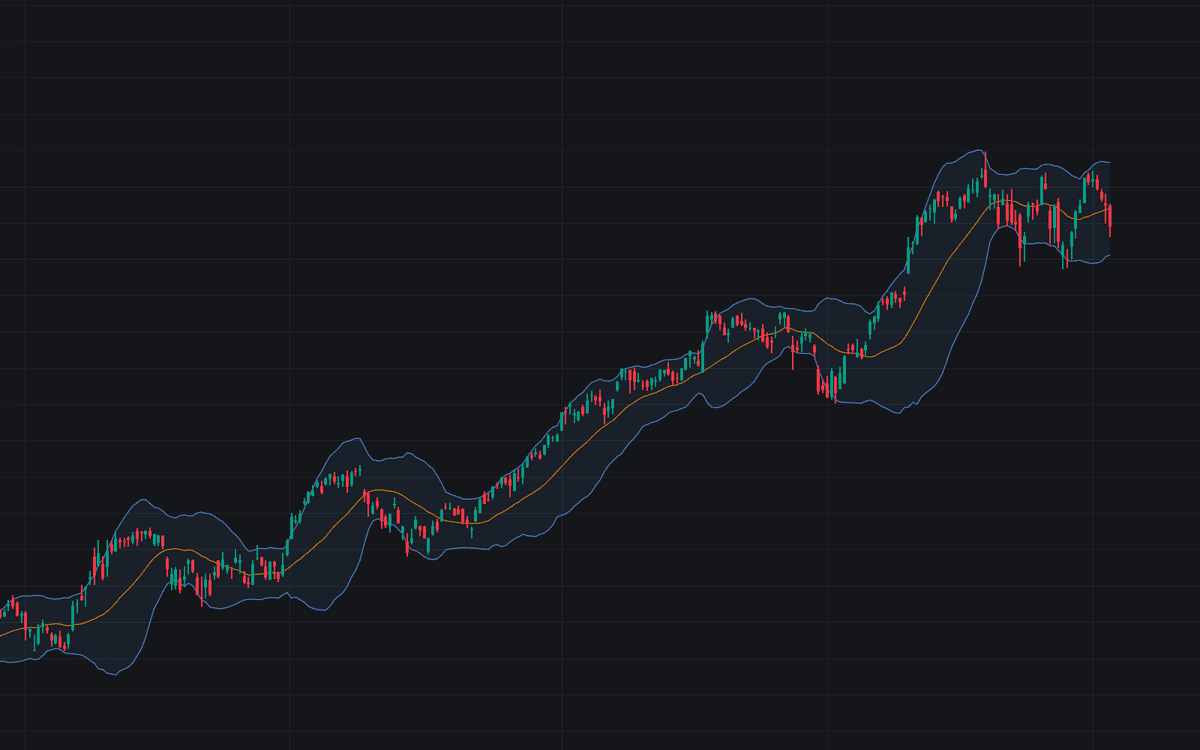

Bollinger Bands wrap price in a self-adjusting envelope: a 20-period simple moving average basis with bands 2 standard deviations away, stretching as prices scatter and pulling in as they settle, so high and low are judged against current volatility. The build implements John Bollinger's classic 20/2.0 construction with a Display selector: the bands themselves, %B, or Bandwidth.
How to Trade the Bollinger Bands?
- Tag of an outer band: price is statistically stretched versus its recent average, a relative high or low, not an automatic signal.
- Pullback to the Basis: in trends the middle band is a drifting mean where pullbacks are evaluated for continuation.
- Narrow Bandwidth: tight bands show a market winding up; major moves often launch from the tightest readings, which Bandwidth quantifies.
- %B above 1 or below 0: the source is closing outside the bands entirely, the strongest stretch; %B mode adds dashed guides at 1, 0.5, and 0.
A band touch is a data point, not an instruction: closes beyond a band are routine in trends, so direction should come from structure or momentum. Alert conditions Cross Above Upper Band and Cross Below Lower Band fire when the close crosses an outer band.
Bollinger Bands Settings
- Length (default 20): the window for the Basis SMA and the standard deviation. Shorter hugs price and multiplies band tags, longer builds a smoother envelope.
- Source (default close): the price series the bands are calculated on.
- Multiplier (default 2.0): standard deviations between Basis and bands. Lower gives frequent touches, higher isolates rarer, more significant excursions.
- Display (default Bands): the on-chart envelope with fill, %B (position within the bands: 1 upper, 0 lower), or Bandwidth (separation relative to the Basis, the squeeze gauge).
Frequently Asked Questions

The Library is free. Quant makes it yours.
Pull any concept or indicator into Quant: rebuild it, retune it, or turn it into a backtested strategy of your own.