Concept
Bollinger Bands
Bollinger Bands are Volatility concepts. The Library holds 2 implementations, each one a working definition you can pull into Quant.
Top Bollinger Bands indicator
The top custom implementation, built on the original standard Bollinger Bands formula.
2 total
From studying Bollinger Bands to trading it: take any implementation below into Quant and backtest it instantly.
.png&w=3840&q=75)
The standard Bollinger Bands indicator
Bollinger Bands exactly as classically defined: the faithful reference build of the original formula, free to run in Quant.
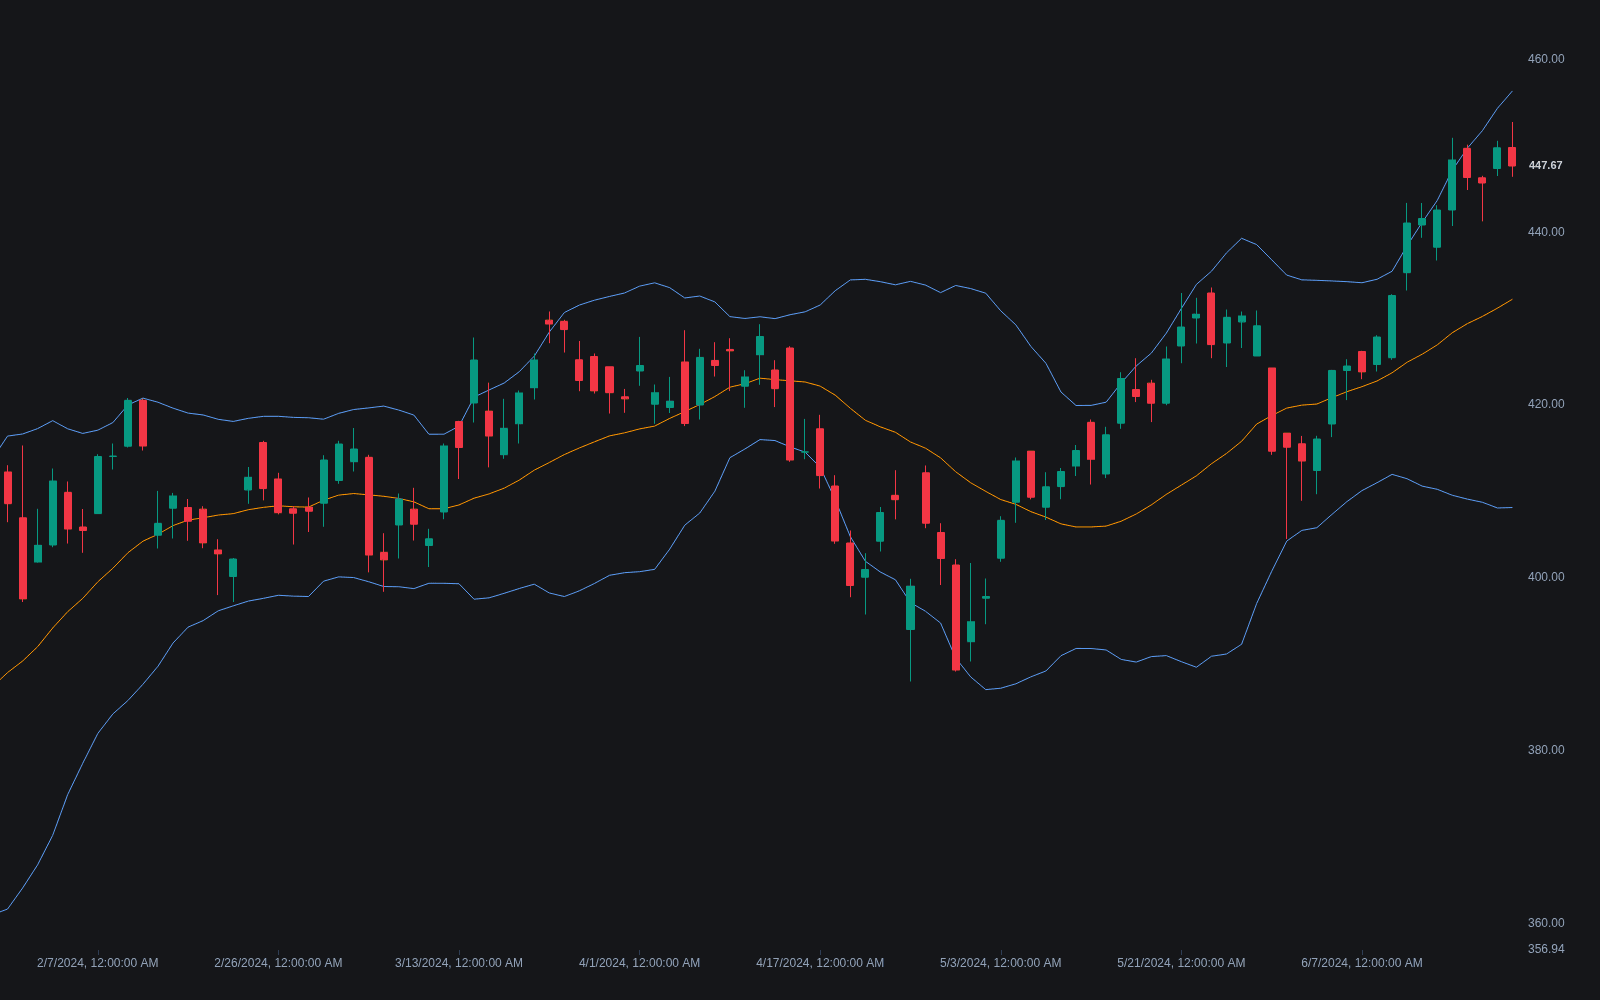
What are Bollinger Bands?
Bollinger Bands are a three-line volatility envelope developed by John Bollinger in the early 1980s. The middle band is a moving average, by default a 20-period SMA of closes. The upper and lower bands sit two standard deviations above and below it, with the deviation measured over the same 20-bar window. Standard deviation gauges how widely prices are scattering, so the bands widen in volatile markets and tighten in quiet ones without any manual adjustment.
That adaptive width makes the bands a relative definition of high and low. A tag of the upper band says price is stretched against its recent average, not that it must reverse; in strong trends price can close along a band for many bars. Two companion measures sharpen the read: %B locates price within the bands on a 0-to-1 scale, and BandWidth expresses band spread as a fraction of the middle band, the standard way to quantify compression.
The bands matter because one overlay frames both regimes: narrow bands flag coiling that often precedes expansion (the Bollinger Squeeze), wide bands warn that a move is already extended, and the middle band doubles as a drifting mean for reversion targets. The hedge is built in. Band tags are information, not signals, and by Bollinger's own account default settings contain roughly 88 to 89 percent of price action, not the textbook 95, so closes beyond the bands are expected events.
How to calculate Bollinger Bands
The construction takes one average and one dispersion measure over the same window.
- 1Compute the middle band: a 20-period simple moving average of closing prices is the standard default.
- 2Compute the standard deviation of the same closes over the same 20 bars (most charting platforms use the population form).
- 3Plot the upper band at the middle plus two standard deviations and the lower band at the middle minus two.
- 4If you change the lookback, scale the multiplier with it: Bollinger suggested roughly 1.9 standard deviations at 10 periods and 2.1 at 50 to keep containment comparable.
How it's calculated
Bollinger Bands frame price with an upper and lower band set k standard deviations around an n-bar simple moving average.
Most platforms use the population standard deviation (divide by n, as above); dividing by n - 1 widens the bands slightly.
Derived readings: %B = (C_t - Lower_t) / (Upper_t - Lower_t) and BandWidth = (Upper_t - Lower_t) / Basis_t.
How traders use it
- As a compression screen: extreme low BandWidth marks a coiling market, and traders prepare for expansion while taking direction from the eventual break, structure, or volume, since the squeeze itself is direction-neutral; the TTM Squeeze formalizes this by checking when the bands fit inside an ATR-based channel.
- For range mean reversion: inside a trading range, an outer-band tag followed by a close back inside sets up rotation toward the middle band, the template behind Bollinger Band Tag Reversion.
- For trend riding: strong trends walk the outer band while the middle band catches pullbacks, so repeated closes on the band read as strength to hold, not overextension to fade.
- As a normalization layer: %B maps any instrument onto the same 0-to-1 scale, feeding screeners, divergence checks, and systematic rules that need volatility-adjusted inputs rather than raw price.
Bollinger Bands vs other bands and channels
Keltner Channels: Keltner Channels center on an EMA and set width with ATR rather than standard deviation. ATR is smoother, so Keltners contract less violently; the Bollinger-inside-Keltner condition is the basis of the TTM Squeeze.
Donchian Channels: Donchian Channels plot the highest high and lowest low of the lookback, with no average and no deviation term. They mark range extremes for breakout logic, while Bollinger Bands mark statistical distance from a mean.
Envelope: A moving average envelope offsets the MA by a fixed percentage, so its width never adapts. Bollinger Bands replace the fixed offset with a standard-deviation term that expands and contracts with volatility.
STARC Bands: STARC Bands shift a simple moving average by a multiple of ATR, closer in spirit to Keltner Channels. ATR-based bands respond to true range, including gaps, rather than to the dispersion of closes.
Concept family
Volatility
57 concepts mapped · 57 in the Library
Bollinger Bands FAQ
Turn Bollinger Bands into a trading strategy.
Take any implementation from this page into Quant, then build on it, backtest it on real data, and keep refining it in conversation.