Chaikin Volatility
 By LuxAlgoApr 13, 2020
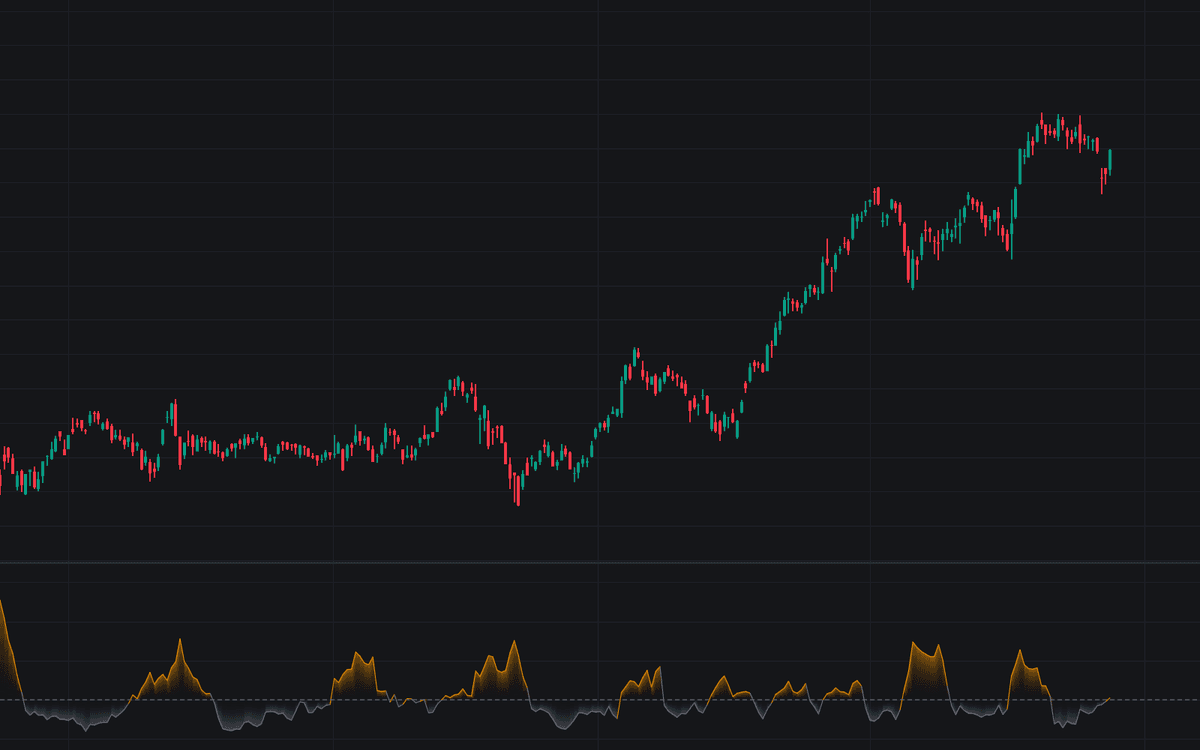

The Chaikin Volatility indicator tracks how quickly the market's trading range is expanding or contracting. It smooths each bar's high-low spread with an exponential moving average, then plots the percentage change of that smoothed spread against its value a set number of bars earlier: above zero, average ranges are wider than before; below zero, the tape is compressing. Defaults follow the classic settings of a 10-period EMA of the range with a 10-period rate of change, and the build keeps the indicator in its standard raw form as defined by Marc Chaikin.
How to Trade the Chaikin Volatility?
- CHV above zero and rising: bar ranges are widening: the environment of breakouts, climaxes, and news-driven tape, whichever way price heads.
- CHV below zero: the average spread is narrower than before: quiet, contracting tape, the condition breakout traders screen for.
- Sharp upward spikes: rapid expansion often marks emotional tape; Chaikin linked fast spikes during declines to capitulation near bottoms, a tendency, not a rule.
- Breakout check: a level break is more convincing when CHV turns positive alongside it. The expansion real moves require is present.
The line is direction-blind (it describes the width of bars, not which side is winning), so pair it with price structure or a directional tool.
Chaikin Volatility Settings
- EMA Length (default 10): the smoothing applied to the bar high-low range. Longer values turn the line into a slow regime gauge; shorter values make it spiky and reactive.
- ROC Length (default 10): how many bars back the smoothed range is compared. Shorter values highlight sudden shifts; longer ones frame expansion against a broader baseline.
Alerts
Zero Cross Up and Zero Cross Down alert conditions fire when the line crosses above or below zero.
Frequently Asked Questions

The Library is free. Quant makes it yours.
Pull any concept or indicator into Quant: rebuild it, retune it, or turn it into a backtested strategy of your own.