Concept
Chaikin Volatility
Chaikin Volatility is a Volatility concept. The Library holds 1 implementation, a working definition you can pull into Quant.
The standard Chaikin Volatility indicator
Chaikin Volatility exactly as classically defined: the faithful reference build of the original formula, free to run in Quant.
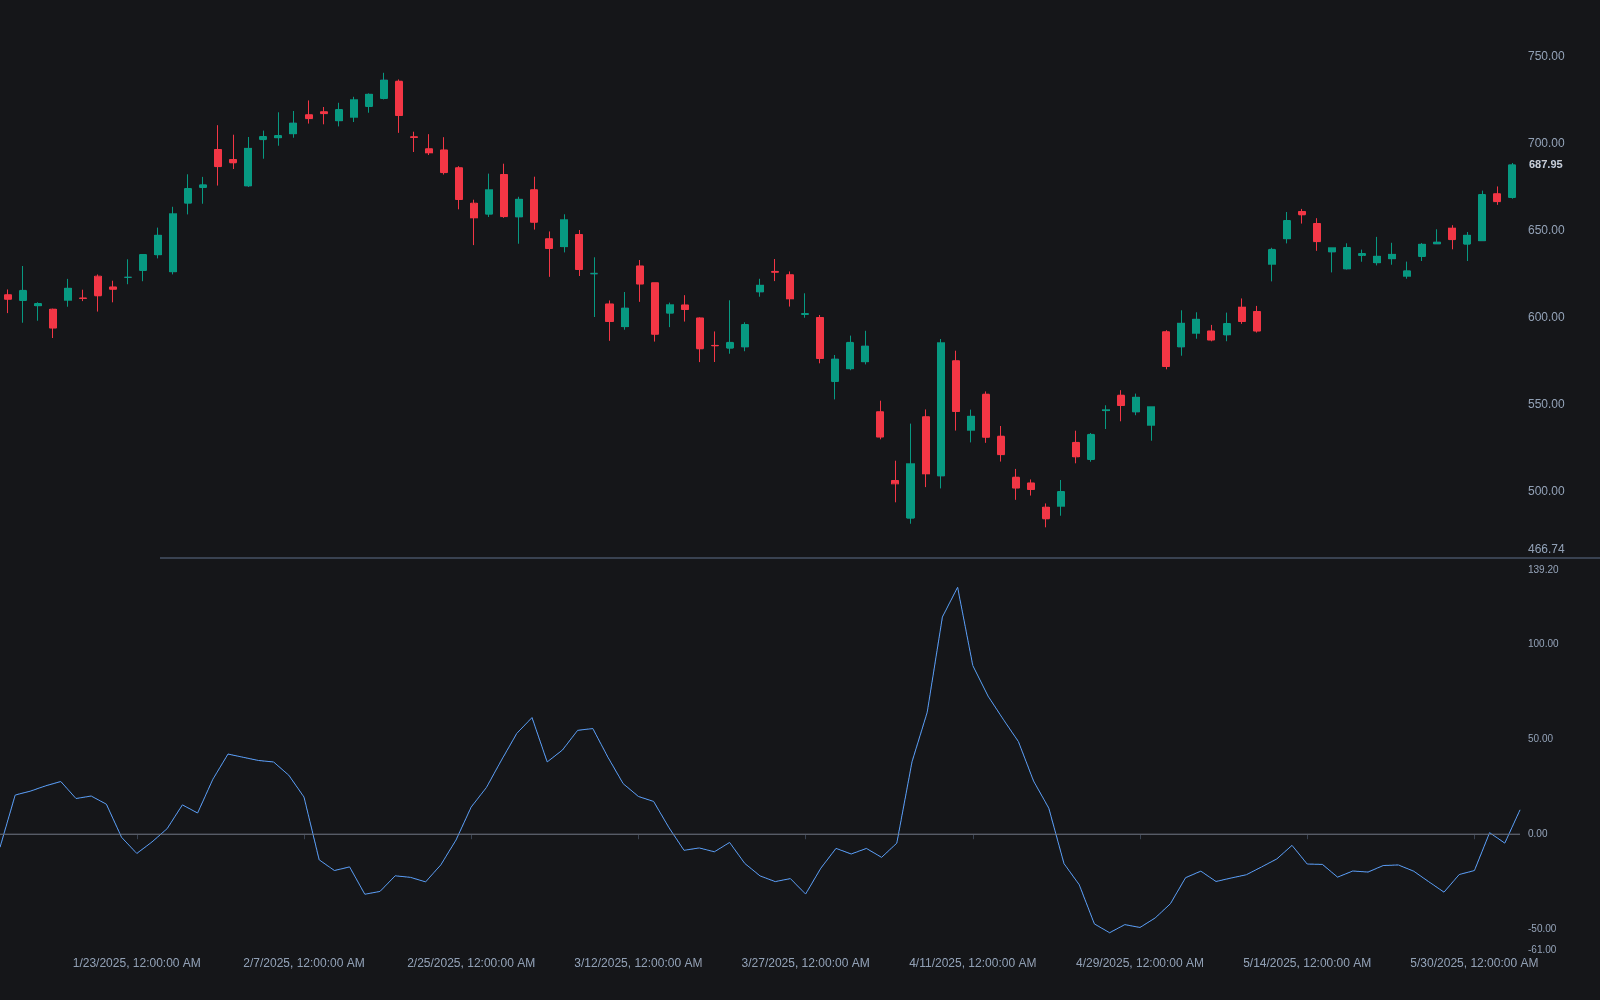
What is Chaikin Volatility?
Chaikin Volatility, developed by Marc Chaikin, measures volatility as the rate of change of the average bar spread. It takes an exponential moving average of each bar's high minus low, then expresses how much that smoothed spread has grown or shrunk over a lookback, as a percentage. Rising readings mean bars are widening; falling readings mean the market is compressing.
The design choice that defines it is what it leaves out: by building on the high-to-low spread alone, it ignores gaps between sessions. That is the key contrast with ATR, whose true range anchors to the prior close precisely to capture gaps. On instruments that gap frequently, Chaikin Volatility can read quiet while ATR reads loud, because the movement is happening between bars rather than inside them.
Chaikin's suggested interpretation ties volatility change to market phase: a sharp rise in the indicator over a short period often accompanies panic selling into a bottom, while a slow decline in volatility can accompany a maturing top. These are tendencies observed in equities, not rules; the indicator itself is direction-blind and only describes how spread behavior is changing.
How it's calculated
An EMA of the high-low spread, converted to a percentage rate of change over the same or a separate lookback.
Many platforms use n = m = 10; both are adjustable and change the indicator's responsiveness materially.
Because it uses only high minus low, gaps between bars are invisible to it.
Readings oscillate around zero: positive means the average spread is wider than m bars ago, negative means narrower.
How traders use it
- As an expansion alarm: a fast spike in Chaikin Volatility flags that bar ranges are blowing out, which in downtrends often coincides with capitulation-style selling and, in Chaikin's reading, can precede a bottom. It marks the environment, not the turn itself.
- As a compression screen: persistently falling readings identify quiet, narrowing markets, complementing tools like the Bollinger Squeeze or NR4/NR7 narrow-range bars when hunting for pre-breakout conditions.
- As a filter on breakout quality: a level break accompanied by rising Chaikin Volatility shows genuine range expansion behind the move, whereas a break on flat readings lacks that expansion evidence and has historically been more prone to failure, though neither reading settles the outcome by itself.
- Its main limitation is gap blindness: on stocks that move through earnings gaps or futures that jump at reopen, it understates realized movement, so many traders cross-check it against a gap-aware measure before trusting a quiet reading.
Chaikin Volatility vs adjacent measures
ATR: ATR averages the true range, which includes gaps from the prior close, and is denominated in price units. Chaikin Volatility uses only the intrabar spread and outputs a percentage rate of change, so it measures how volatility is changing rather than its level.
Chaikin Oscillator: Same author, different subject. The Chaikin Oscillator is a momentum reading on the accumulation/distribution line, built from volume and close location. Chaikin Volatility involves no volume at all.
Close-to-close Historical Volatility: Historical volatility is the annualized standard deviation of close-to-close returns and sees nothing inside the bar. Chaikin Volatility sees only inside the bar. The two can disagree sharply on gappy instruments.
Concept family
Volatility
57 concepts mapped · 57 in the Library
Chaikin Volatility FAQ
Turn Chaikin Volatility into a trading strategy.
Take the implementation from this page into Quant, then build on it, backtest it on real data, and keep refining it in conversation.