Choppiness Index
 By LuxAlgoApr 13, 2020
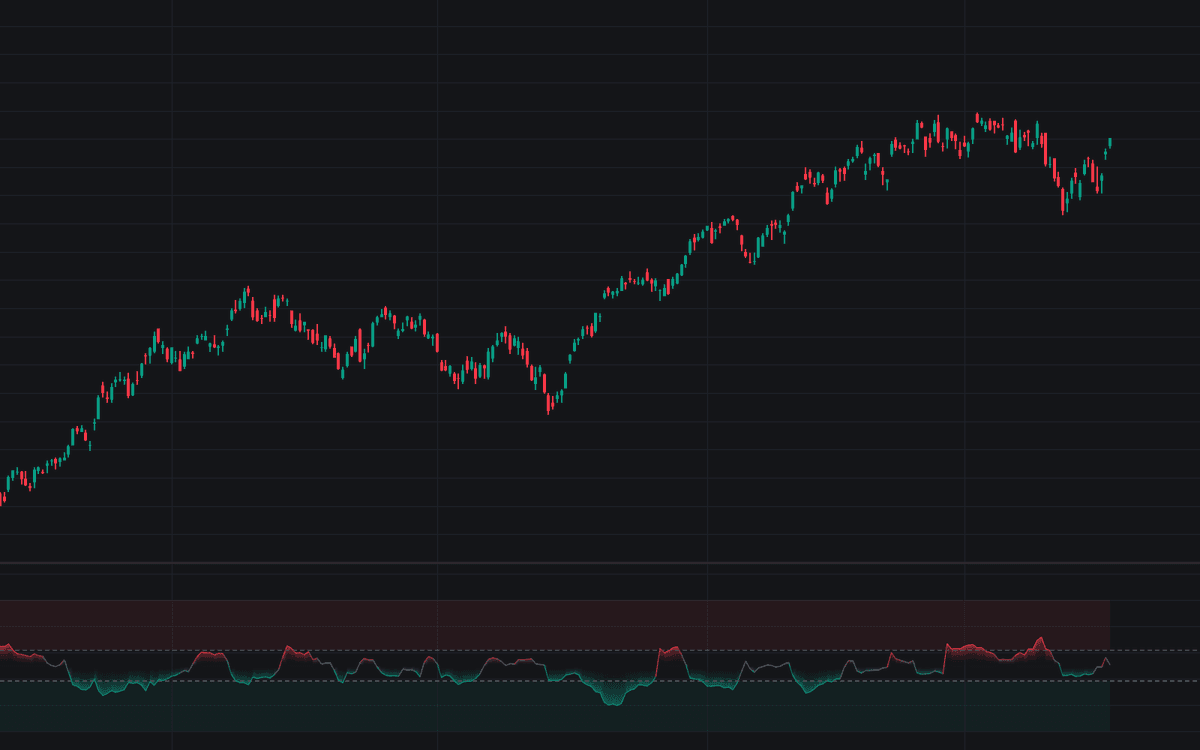

The Choppiness Index quantifies whether price is trending or ranging on a 0 to 100 scale. It sums true ranges across the lookback, measures that total against the window's overall high-low span, and log-normalizes the ratio so the theoretical bounds hold at any length. Congested, overlapping bars drive the index toward 100; efficient travel in one direction pulls it toward 0. The build plots E.W. Dreiss's standard formula without alteration, using the classic length of 14 and the conventional 61.8 and 38.2 reference bands with a shaded zone between them.
How to Trade the Choppiness Index?
- CHOP above the Upper Band (61.8): congested tape: favor range tactics, fade extremes, stand down on fresh trend entries.
- CHOP below the Lower Band (38.2): efficiently directional movement: trend entries and trailing exits have the wind at their back.
- Inside the shaded band: ambiguous conditions; neither regime has claimed the tape.
- Rolling over from high readings: after a long stay above the upper band, a downturn hints the congestion is resolving. Watch for breakout attempts.
- Rising during an open trend trade: persistence is fading, a common cue to tighten stops or take partials.
The index summarizes the whole lookback and reacts with a delay: even an explosive breakout bar takes a few bars to pull it down.
Choppiness Index Settings
- Length (default 14): the window for both the true-range sum and the highest-high to lowest-low span. Shorter lengths re-classify quickly but flicker; longer ones give stable calls later.
- Upper Band (default 61.8): the threshold above which readings count as choppy.
- Lower Band (default 38.2): the threshold below which readings count as trending.
Alerts
The script declares two alert conditions: Trending Market, when the index crosses below the lower band, and Choppy Market, when it crosses above the upper band.
Frequently Asked Questions

The Library is free. Quant makes it yours.
Pull any concept or indicator into Quant: rebuild it, retune it, or turn it into a backtested strategy of your own.