Concept
Choppiness Index
Choppiness Index is a Volatility concept. The Library holds 1 implementation, a working definition you can pull into Quant.
The standard Choppiness Index indicator
Choppiness Index exactly as classically defined: the faithful reference build of the original formula, free to run in Quant.
What is the Choppiness Index?
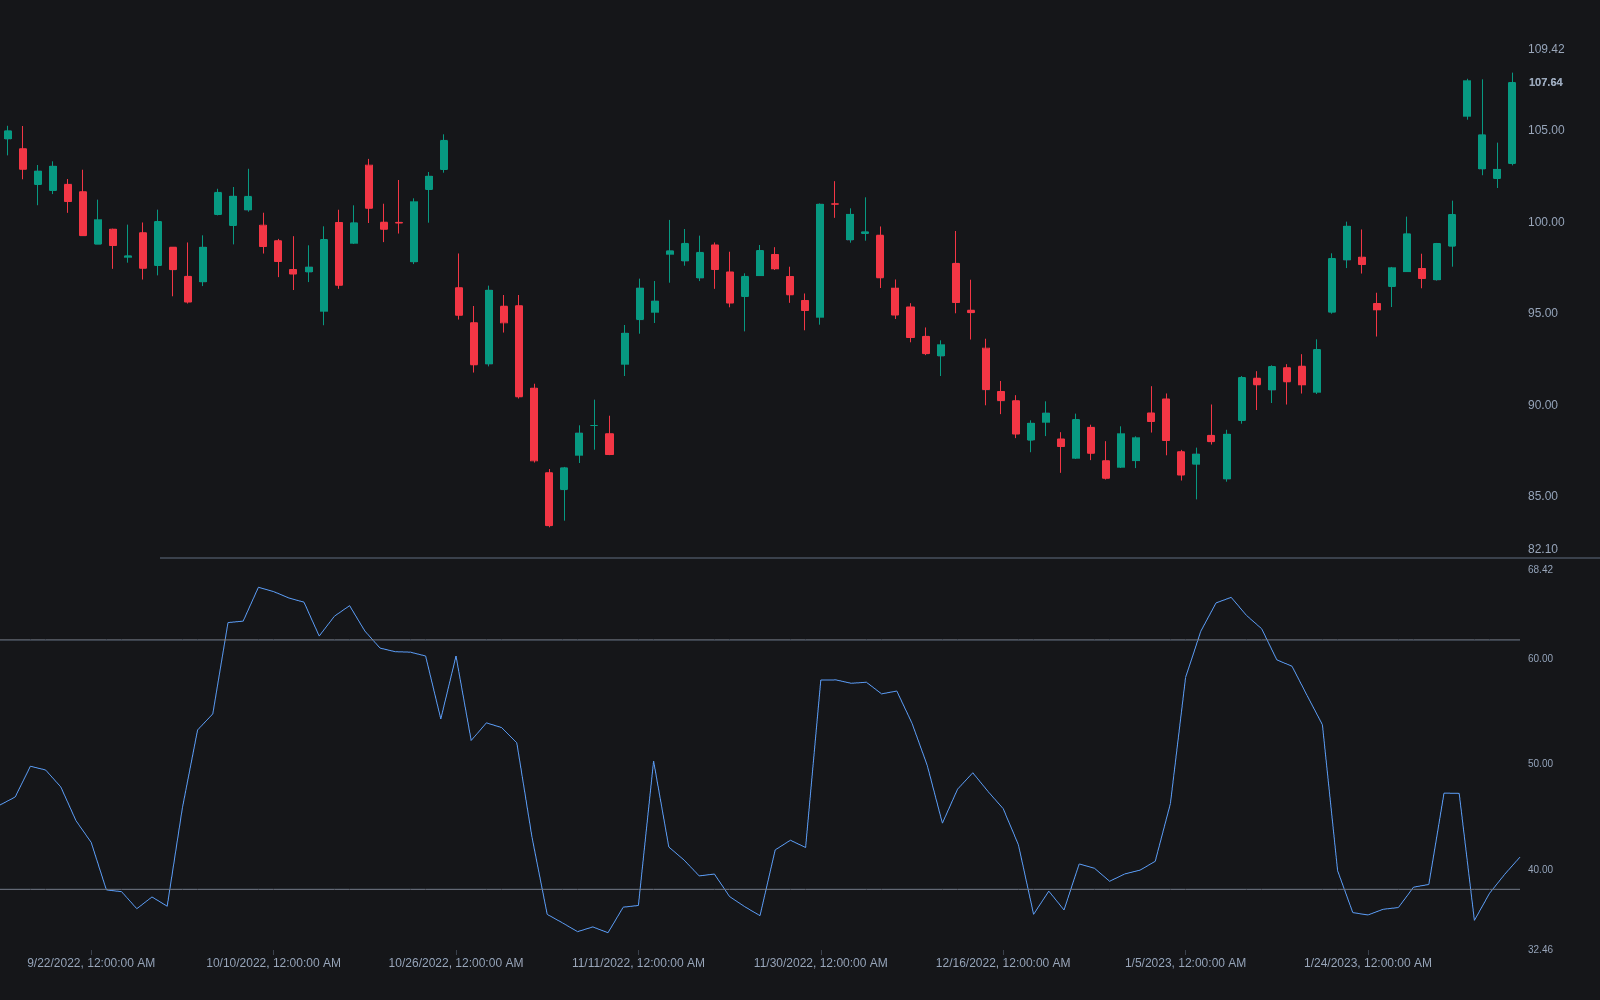
The Choppiness Index (CHOP) is a 0-100 gauge of how directional recent price action has been, created by Australian commodity trader E.W. Dreiss. It compares the path traveled with the ground covered: the sum of each bar's true range over a lookback (14 is standard) divided by the window's total high-low range, log-scaled and normalized by the log of the lookback. Heavy zigzagging inside a narrow span pushes the index high; bars stacking in one direction pull it low.
Dreiss developed the index in the early 1990s, reportedly drawing on fractal ideas about how price fills space: a market that wanders back and forth traces a longer path per unit of net progress than one that travels cleanly. The log normalization is what makes the reading comparable across lookbacks and instruments, pinning the theoretical extremes at 0 and 100 regardless of the window.
Readings above 61.8 are conventionally labeled choppy and readings below 38.2 trending; the thresholds are Fibonacci borrowings, not statistical guarantees. CHOP is deliberately non-directional: it says whether a trend exists, never which way it points, which places it among trend/range classifiers rather than signal generators.
Its practical personality follows from the construction. The index is a lagging summary of the whole window, so it confirms regimes rather than anticipating them, and a single explosive bar can drag it down while the window digests the move. It also says nothing about volatility level: a violent but efficient decline reads as trending, and a quiet drift inside a tight band can still read choppy. That is why it pairs with direction tools on one side and volatility gauges such as BandWidth or a volatility percentile on the other.
How to read the Choppiness Index on a chart
CHOP plots in its own 0-100 pane; the reading is about band position and how long the index has camped there.
- 1Add the index with the standard 14-period lookback beneath the chart and mark the conventional 61.8 and 38.2 guide levels.
- 2Read the band: above the upper level the window's action has been congested; below the lower level it has been efficiently directional; between them, ambiguous.
- 3Weigh duration: a long stay above the upper band marks a mature consolidation, the kind that precedes many expansions, while a long stay low marks a persistent trend.
- 4Watch the rollover: the index turning down from the high band says rotations are giving way to progress, a read worth cross-checking against a Bollinger squeeze or TTM squeeze firing.
- 5Confirm direction elsewhere: CHOP is direction-blind by design, so the side of any emerging move must come from structure or a directional indicator.
How it's calculated
Scores how range-bound (high readings) or directional (low readings) the last n bars were, on a 0 to 100 scale.
Published by Australian trader E.W. Dreiss; values are bounded between 0 and 100 by construction.
Conventional thresholds are Fibonacci-derived: above 61.8 reads as consolidation, below 38.2 as a strong trend, and the index carries no information about trend direction.
The numerator is the sum of single-bar true ranges (ATR of length 1 summed over n), not a smoothed ATR.
How traders use it
- As a regime filter: trend-following entries are gated to low or falling readings, while mean-reversion tactics take over when the index is pinned high inside a range.
- As breakout preparation: a long stay above the upper threshold marks a mature consolidation, so traders watch for the index to roll over as a breakout attempt develops, accepting that compression can always extend further.
- As exit context: a rising index during an open trend trade warns that directional persistence is fading, prompting tightened stops or partial exits.
- As a sizing modulator: systems sometimes scale trend-trade size down as CHOP rises, on the logic that entries taken inside congestion carry worse odds than the same signals in an efficient tape.
- As a timeframe selector: a high daily reading with a low intraday reading argues for range tactics at swing scale and trend tactics only inside the day, keeping strategy and regime matched per timeframe.
Choppiness Index vs similar gauges
ADX / DMI System: ADX rises with persistent directional movement and ships with +DI/-DI direction lines; CHOP rises with congestion and is direction-blind. They answer near-opposite questions and are sometimes read together, low CHOP plus rising ADX being the stronger trend vote.
Kaufman Efficiency Ratio: The efficiency ratio divides net change by the sum of absolute bar-to-bar changes, running from 0 (pure chop) to 1 (perfect trend), the mirror of CHOP's orientation. It is mostly consumed inside adaptive moving averages rather than plotted as a standalone regime dial.
BandWidth: BandWidth measures how wide the Bollinger envelope is, a volatility level. CHOP measures how tangled the path inside the envelope is, an efficiency read. A market can be violent and trending (low CHOP, high BandWidth) or quiet and tangled (high CHOP, low BandWidth).
Concept family
Volatility
57 concepts mapped · 57 in the Library
Choppiness Index FAQ
Turn Choppiness Index into a trading strategy.
Take the implementation from this page into Quant, then build on it, backtest it on real data, and keep refining it in conversation.