Churn
 By LuxAlgoOct 9, 2026
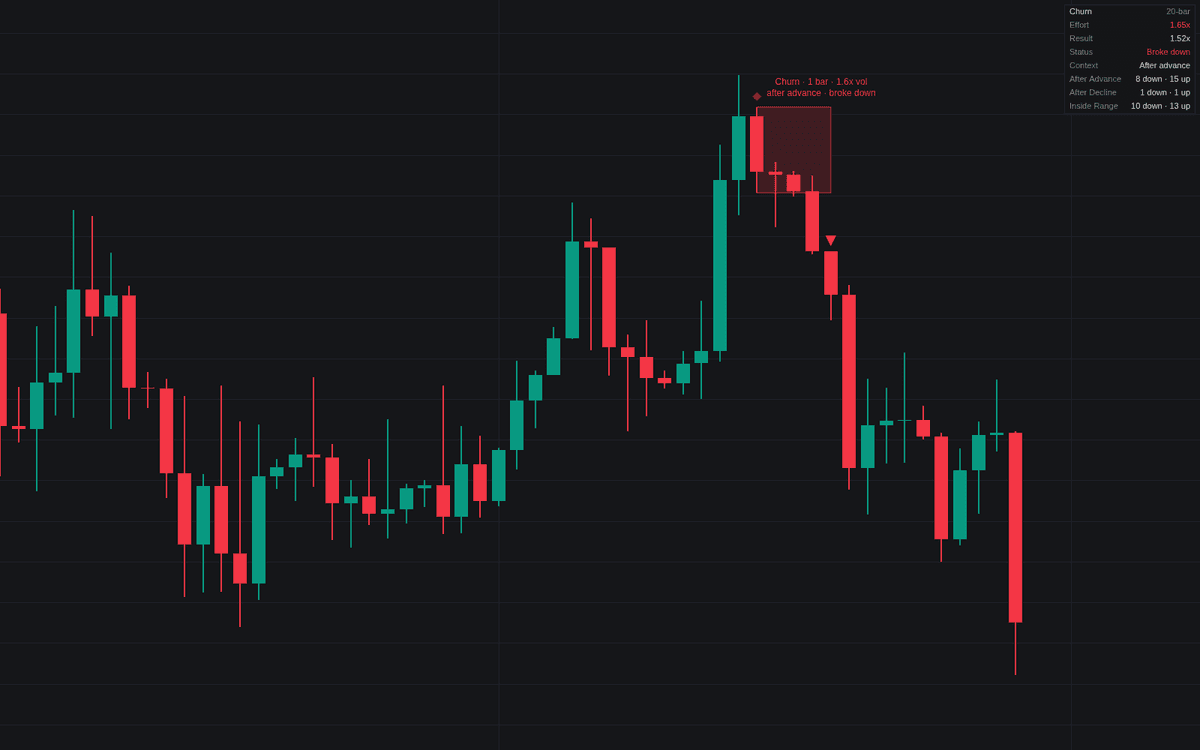

Churn identifies market conditions where high trading effort results in minimal price movement, highlighting intense battles between buyers and sellers within a restricted range. By measuring volume against expected price displacement, this indicator detects periods of consolidation or "churn" that often precede significant market moves. Traders can leverage this tool to identify zones of trapped liquidity, helping to anticipate breakouts or reversals before they occur by focusing on the relationship between institutional effort and actual price travel.
How to Trade the Churn?
Trading with this indicator relies on the concept of effort versus result. A churn event occurs when volume is exceptionally high, yet the bar range remains narrow. This suggests that aggressive participants are meeting equal resistance, creating a "zone" of potential breakout.
When a zone forms, monitor the price as it approaches the upper or lower boundaries. A valid resolution typically requires a breakout bar with an expanded range, confirming that one side has finally overwhelmed the other.
Consider the context provided by the dashboard. Churn occurring after a strong advance often acts as a distribution warning, suggesting that sellers are absorbing the upward momentum. Conversely, churn after a significant decline may indicate accumulation as buyers step in to halt the downward trend. Use the provided zone labels to gauge the average volume and close location, which can help differentiate between a temporary pause and a true change in character. When a breakout occurs, look for follow through in the direction of the expansion to confirm the new trend.
Churn Settings
Churn Detection
- Baseline Length: The number of bars used to calculate the average volume and range for determining normal market activity.
- Volume Threshold: The minimum relative volume required to flag a bar as potential churn.
- Result Threshold: The maximum allowable bar range for high volume to be considered churn.
- Fit Lookback: The window size for fitting the relationship between volume and range.
- Exclude Gap Bars: Toggles a filter to ignore market gaps, which often contain non informative volume.
- Skip Expiration Fridays: Removes periods associated with option expirations or index rebalancing to prevent false signals.
Churn Sequences
- Detect Churn Sequences: Toggles the detection of clusters of heavy volume within tight bands.
- Sequence Length: The number of bars analyzed in a rolling window for sequence detection.
- Sequence Volume: The required minimum average volume across the sequence window.
- Band Tightness: The maximum price span allowed for a sequence to be flagged.
Zones & Resolution
- Merge Gap: The number of bars allowed between churn events to keep them as part of the same zone.
- Breakout Expansion: The multiplier for average range required to confirm a zone resolution.
- Resolution Window: The duration in bars to wait for a zone to break before marking it as unresolved.
Context & Dashboard
- Context Lookback: The number of bars analyzed to determine the market trend preceding a zone.
- Trend Threshold: The net move in average range multiples required to qualify a trend.
- Dashboard Settings: Controls for displaying the dashboard, including its position on the chart and text size.
Frequently Asked Questions
Free on Vela
Run it on Vela. Go further with a paid plan.
- Up to 500 strategy alerts, with webhook automation
- Up to 10× the chart history of Free
- Orderflow lookback up to full history
- Up to 100,000 monthly credits for Quant to customize it
- Futures data alongside crypto, stocks, forex and commodities

Run it on Vela. Make it yours with Quant.
Open this indicator free on Vela, our next-generation charting platform. Then ask Quant, our coding agent built into Vela, to retune it or turn it into a backtested strategy of your own.