Connors RSI
 By LuxAlgoApr 13, 2020
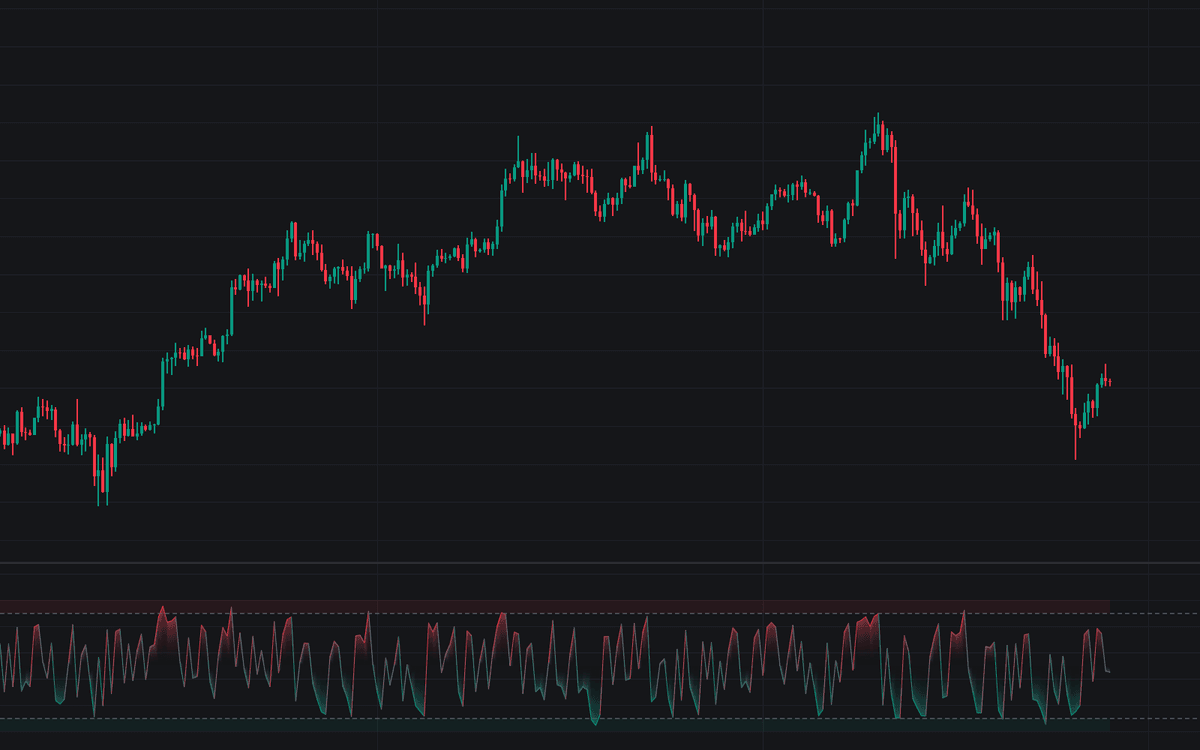

The Connors RSI is a composite oscillator built for short-term mean reversion. It averages three components, each scaled 0 to 100: a fast RSI of price, an RSI of the streak (the signed count of consecutive up or down closes), and the percent rank of the one-bar rate of change against its recent history. This build is an unmodified implementation of the published formula, with the classic 3/2/100 defaults and 90/10 reference levels. All three inputs are short, so the line reaches its extremes constantly by design: a tactical stretch score spanning a few bars, not a trend gauge.
How to Trade the Connors RSI?
- CRSI below the Oversold level (10): stretched down on magnitude, persistence, and rarity at once: the classic mean-reversion long, usually gated by a longer-term uptrend filter.
- CRSI above the Overbought level (90): the short-side counterpart, best taken with, not against, the higher-timeframe trend.
- Crossing back out of an extreme band: the return through the threshold marks the snap-back the trade was for; published usage keeps holding periods short.
Mid-scale values are noise here, and an extreme flags stretch, never a guaranteed reversal. In strong trends the reading can stay pinned.
Connors RSI Settings
- RSI Length (default 3): the Wilder RSI applied to closing price; longer values thin out extreme prints.
- Streak RSI Length (default 2): the RSI applied to the up/down close streak, the persistence component.
- Percent Rank Length (default 100): the lookback ranking the latest one-bar rate of change; longer windows make "unusual" stricter.
- Overbought Level (default 90) and Oversold Level (default 10): the extreme bands; pushing them outward demands rarer readings.
Alerts
Four alert conditions ship: Overbought and Oversold fire when the line crosses into an extreme band, while Overbought Exit and Oversold Exit fire when it crosses back out.
Frequently Asked Questions

The Library is free. Quant makes it yours.
Pull any concept or indicator into Quant: rebuild it, retune it, or turn it into a backtested strategy of your own.