Concept
Connors RSI
Connors RSI is a Momentum & Oscillators concept. The Library holds 1 implementation, a working definition you can pull into Quant.
The standard Connors RSI indicator
Connors RSI exactly as classically defined: the faithful reference build of the original formula, free to run in Quant.
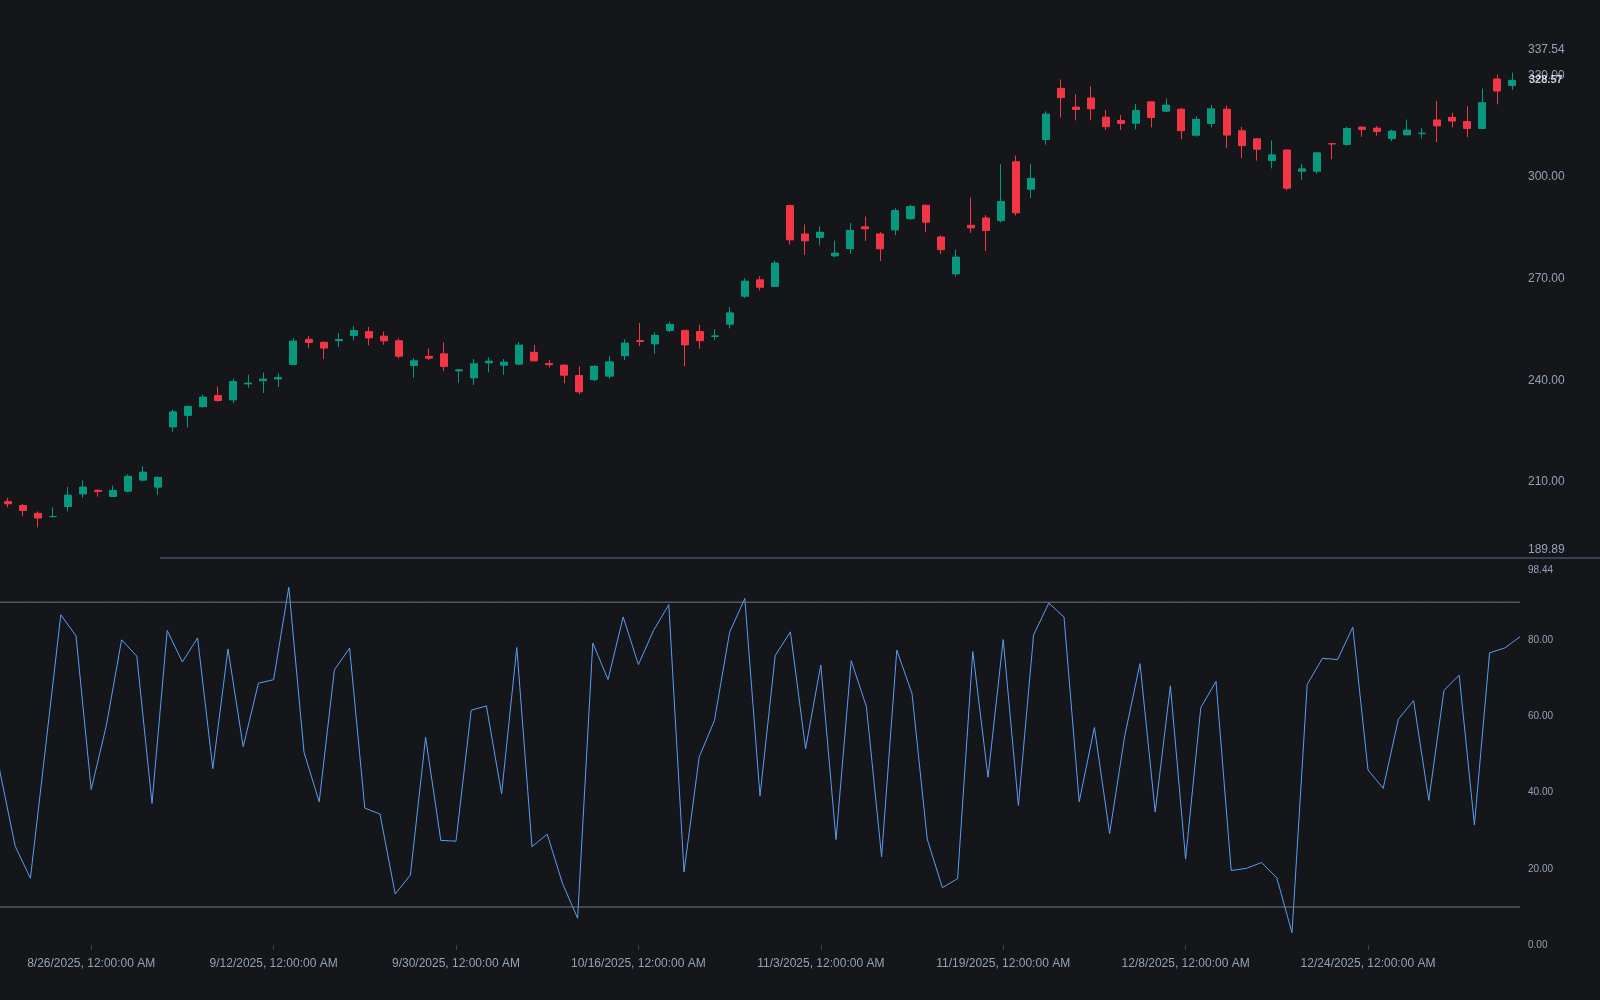
What is Connors RSI?
Connors RSI is a composite oscillator published by Larry Connors' research group for short-term mean reversion. It averages three 0-100 components: a fast RSI of closing price (3 periods in the standard form), an RSI of the streak (the signed count of consecutive up or down closes, typically 2 periods), and the percentile rank of the latest one-bar return against the prior 100 returns. The blend scores how far price has pushed, how persistent the push has been, and how unusual the latest bar is.
The indicator arrived through Connors Research publications in the early 2010s as the packaged successor to a decade of the group's short-lookback studies, quantified equity mean-reversion rules built on fast RSIs, streaks, and rank statistics. ConnorsRSI folded those three research threads into one number, which is why each component reads like a citation of an earlier Connors finding.
It extends the same philosophy as Connors' earlier short-lookback work such as RSI-2: fast, extreme readings that flag stretched conditions expected, though never guaranteed, to snap back within a few bars. With three short inputs the indicator swings to its extremes frequently and is designed for tactical entries, not trend measurement.
The published usage carries its own guardrails. Extremes are conventionally deeper than standard RSI practice (90/10 or 95/5 rather than 70/30), trades are taken with a long-term trend filter rather than against it (the research convention gates longs to instruments above their 200-day average), and exits are quick, on the reading crossing back through mid-scale within a few bars. The design's known limits are the mirror of its strengths: it says stretched, never how long a strong trend can stay stretched, and its equity-centric research base transfers unevenly to other asset classes.
How to read Connors RSI
The reading is a fast stretch score; the discipline is the filter and the exit.
- 1Add the indicator with its standard parameters (3-period price RSI, 2-period streak RSI, 100-bar return rank), equally weighted.
- 2Mark deep extreme bands: 90/10 as the common working thresholds, 95/5 for stricter versions; the indicator visits ordinary levels constantly.
- 3Gate by regime: the published convention takes oversold readings long only above a long-term trend filter such as the 200-day average, and the mirror for shorts.
- 4Enter at extremes, not on crosses: the design expects snap-back within a few bars of a qualified extreme.
- 5Exit mechanically at mid-scale: readings crossing back through the 50 area define the reversion the trade was for.
- 6Stand down around gaps and scheduled events, where the one-bar arithmetic all three components rely on is dominated by news.
How it's calculated
A composite mean reversion oscillator averaging three 0 to 100 components: a short price RSI, an RSI of the up/down streak, and the percent rank of the one bar return.
Default parameters are (3, 2, 100); all three components are bounded 0 to 100, so the composite is too.
Connors' rules treat readings below about 10 as oversold and above about 90 as overbought.
Percent rank conventions differ slightly across platforms (strictly below versus below or equal).
How traders use it
- Mean-reversion entries at extremes: readings near the top of the scale (often above 90) mark short-term overbought and readings near the bottom (often below 10) short-term oversold, usually traded in the direction of a longer-term trend filter rather than blindly against strength.
- Exit timing for those trades: positions opened at one extreme are commonly closed when the reading crosses back through a neutral level, keeping holding periods to a handful of bars.
- As one stretch score among several inputs: an extreme value alone says nothing about how long a strong trend can stay extreme, so systems typically pair it with regime and structure context.
- In laddered entries: the research tradition documents scale-in versions that add as the reading deepens (first tranche below 10, second below 5), sizing the ladder in advance in the planned-averaging manner.
- As a comparative screen: ranking a universe by ConnorsRSI surfaces the day's most stretched candidates, with the trend filter then deciding which extremes are tradable pullbacks rather than breakdowns in progress.
Connors RSI vs related oscillators
RSI: Standard 14-period RSI gauges medium-term momentum and visits its extremes rarely; ConnorsRSI compounds three fast measurements so extremes print constantly by design. One is a trend-strength dial, the other a tactical stretch score with a few-bar horizon.
Stochastic RSI: Stochastic RSI manufactures sensitivity by rescaling one RSI within its own range; ConnorsRSI gets there by averaging three different fast measurements (price, streak, return rank). Both chase quick extremes, with the composite spreading its bets across construction styles.
Adaptive/dynamic RSI: Adaptive RSIs change their own lookback with regime, trying to stay calibrated everywhere. ConnorsRSI keeps fixed fast parameters and delegates regime awareness to an external trend filter, a philosophical split about where the adaptation belongs.
Concept family
Momentum & Oscillators
91 concepts mapped · 91 in the Library
Connors RSI FAQ
Turn Connors RSI into a trading strategy.
Take the implementation from this page into Quant, then build on it, backtest it on real data, and keep refining it in conversation.