Coppock Curve
 By LuxAlgoApr 13, 2020
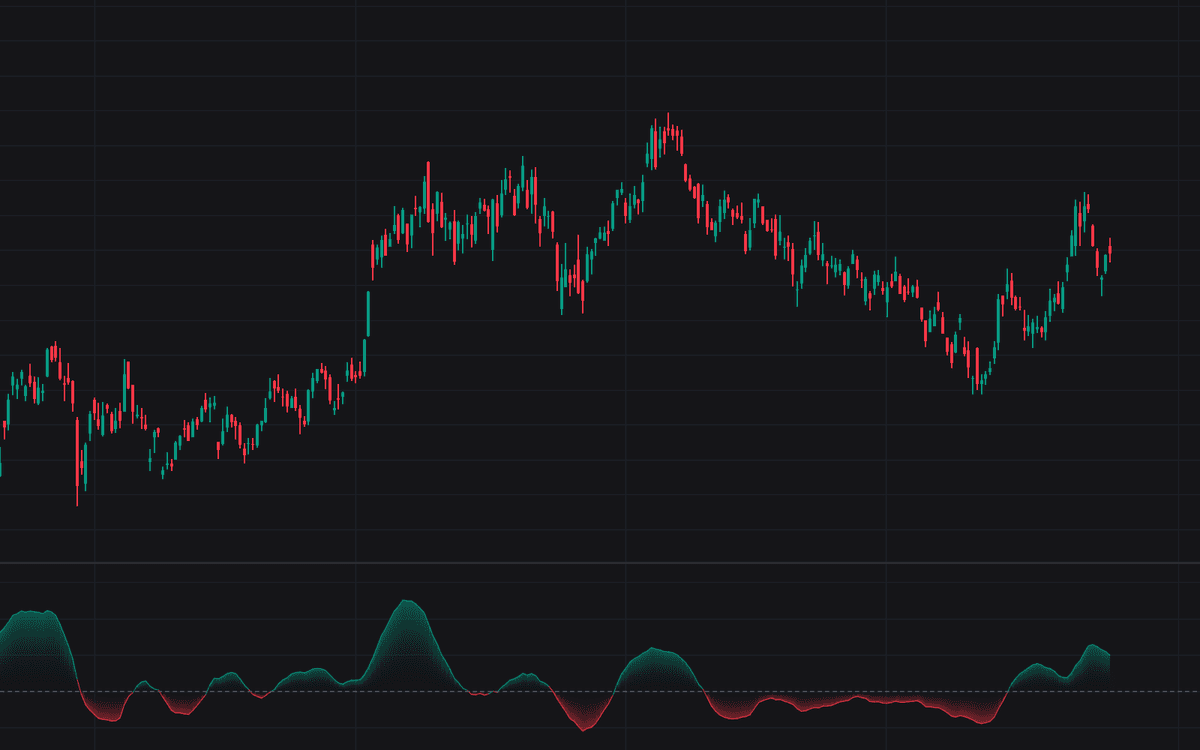

The Coppock Curve is a long-horizon momentum oscillator that smooths the sum of two rate-of-change readings with a weighted moving average. The classic recipe (a 10-period WMA of the 14-period ROC plus the 11-period ROC) comes from Edwin Coppock's 1962 publication, and those original parameters are the defaults here. Designed around monthly closes of broad equity indexes, its celebrated signal is the upward hook that forms while the curve is still below zero. This is the standard implementation of Coppock's indicator, with lookbacks and source exposed as inputs for scaling to other charts.
How to Trade the Coppock Curve?
- Upturn from below zero: the canonical buy condition: momentum that remains negative but has begun to recover. Judge it on completed bars. An in-progress hook can still flatten.
- Zero Cross Up: momentum turning positive; a slower confirmation that an advance has taken hold.
- Downturn from above zero or Zero Cross Down: no part of the original definition, but commonly read as warning that a mature advance is losing momentum.
- Above zero and rising: a supportive long-term backdrop; below zero and falling, the opposite.
Coppock Curve Settings
- WMA Length (default 10): the weighted moving average applied to the summed rates of change; its front-loaded weighting lets recent bars steer the hook.
- Long RoC Length (default 14): the longer rate-of-change lookback, 14 monthly closes in the original definition.
- Short RoC Length (default 11): the shorter rate-of-change lookback, 11 periods classically.
- Source (default close): the price series used for both rate-of-change calculations.
Alerts
Zero Cross Up and Zero Cross Down alert conditions fire as the curve crosses its zero line in either direction.
Frequently Asked Questions

The Library is free. Quant makes it yours.
Pull any concept or indicator into Quant: rebuild it, retune it, or turn it into a backtested strategy of your own.