Concept
Coppock Curve
Coppock Curve is a Momentum & Oscillators concept. The Library holds 1 implementation, a working definition you can pull into Quant.
The standard Coppock Curve indicator
Coppock Curve exactly as classically defined: the faithful reference build of the original formula, free to run in Quant.
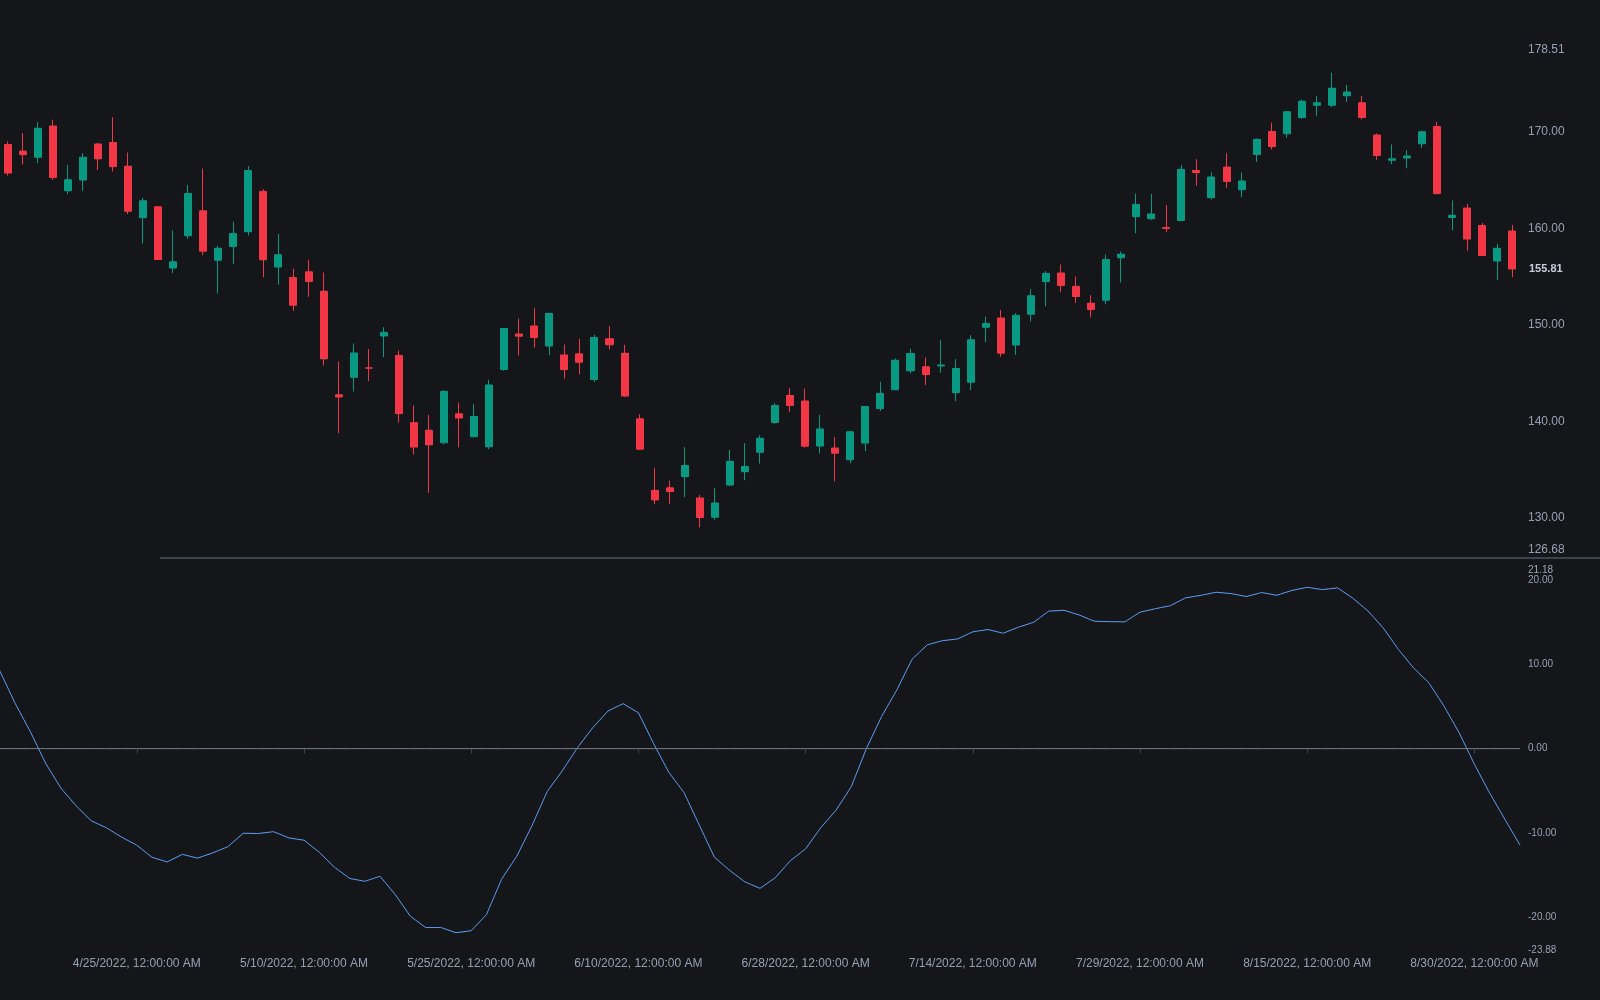
What is the Coppock Curve?
The Coppock Curve is a long-horizon momentum gauge built from smoothed rate of change. The classic construction, published by economist Edwin Coppock in Barron's in 1962, adds a 14-month and an 11-month ROC of a stock index and smooths the sum with a 10-month weighted moving average. Its design brief was narrow: flag major bear-market bottoms on monthly charts. The often-repeated origin story is that Coppock chose the lookbacks after church advisers estimated that mourning lasts 11 to 14 months, reasoning that a bear market is processed like a bereavement.
The canonical signal is a single event: the curve turning upward from below the zero line, read as the start of a new long-term advance. Coppock offered no sell side. Later users added downturns from above zero as warnings, scaled the parameters down for weekly and daily charts, and applied the tool beyond equity indexes; those are extensions, and on fast timeframes the curve turns far more often and far less selectively than the monthly original.
The mechanics reward a second look. Below-zero readings mean the index sits lower than it did 11 and 14 months earlier, so the curve only hunts where a real bear market has already done damage; the front-weighted average then lets the most recent months steer the hook, which is what gives the signal its shape: momentum still deeply negative, but improving. Practitioners citing its record point to upward hooks near the major postwar bottoms, with the 2009 hook the widely cited modern example; the honest counterweight is sample size, since signals arriving a handful of times per decade leave the statistics thin by construction.
Modern usage dresses the classic in standard oscillator clothing: platform builds add a moving average of the curve for mechanical triggers, pivot and divergence detection on faster variants, and freely adjustable lengths. The trade-off is one-directional: every step down in timeframe or lookback trades the original's rare, cycle-scale selectivity for ordinary smoothed-momentum behavior. Scaled to daily bars the Coppock Curve is a fine generic momentum composite, and nothing more; its distinct identity lives on the monthly chart it was designed for.
How to identify the Coppock Curve signal
One construction, one canonical event: the below-zero upward hook on monthly closes.
- 1Work from monthly closing prices of a broad index, the instrument class the tool was designed around.
- 2Compute two rates of change, 14-month and 11-month, and add them.
- 3Smooth the sum with a 10-month weighted moving average, front-weighted so recent months steer.
- 4Wait for the setup: the curve below zero, meaning prices sit under their year-ago levels, the precondition of a bear market already priced.
- 5The signal is the hook: the curve turning upward from below zero on a completed monthly bar, with intramonth hooks treated as provisional until the close.
How it's calculated
A long-term momentum oscillator: a weighted moving average of the sum of two rates of change, designed for monthly index closes.
Edwin Coppock published the indicator in 1962 for monthly Dow and S&P closes; the classic buy signal is an upturn from below zero.
Charting platforms apply the same 14, 11 and 10 defaults on any timeframe and source; added signal lines or different sources are later variations, not part of the original definition.
How traders use it
- As a long-cycle bottom detector on monthly index charts: a decline below zero followed by an upward hook is the classic buy condition, usually evaluated on closed monthly bars so an intramonth hook cannot vanish before the signal is final.
- As a slow regime backdrop: above zero and rising supports risk-on positioning, below zero and falling says long-term momentum is negative, a role similar to a higher-timeframe trend filter.
- Scaled to weekly or daily charts with shorter ROC and smoothing lengths, where it behaves like other smoothed momentum composites and is traded on zero-line crosses and divergences rather than rare cycle turns.
- With mechanical triggers added: a moving average of the curve itself converts the visual hook into a crossover event, tightening the definition at the cost of a little extra delay.
- As one voice in bottom-fishing confluence: allocators pair the monthly hook with breadth washouts and valuation context, using the curve to time scale-in schedules rather than as a lone all-in signal.
Coppock Curve vs related momentum composites
Know Sure Thing: Martin Pring's KST generalizes the same idea. Where the Coppock Curve sums two ROCs under one weighted smoothing and waits for one canonical signal, KST blends four smoothed ROCs with rising weights and trades signal-line and zero-line crosses in both directions.
ROC: ROC is the raw ingredient: a single lookback, no smoothing, read from zero crosses and extremes bar by bar. The Coppock Curve is a weighted, smoothed composite of two ROCs, deliberately slow so it turns only a handful of times per cycle on monthly data.
MACD: MACD measures momentum as the spread of two price averages and serves swing timeframes with signals in both directions. The Coppock Curve is a single-purpose cycle tool: one buy-side event, monthly data, bear-market preconditions. Different clocks, different jobs.
Concept family
Momentum & Oscillators
91 concepts mapped · 91 in the Library
Coppock Curve FAQ
Turn Coppock Curve into a trading strategy.
Take the implementation from this page into Quant, then build on it, backtest it on real data, and keep refining it in conversation.