DeMark Pivots
 By LuxAlgoJul 7, 2026
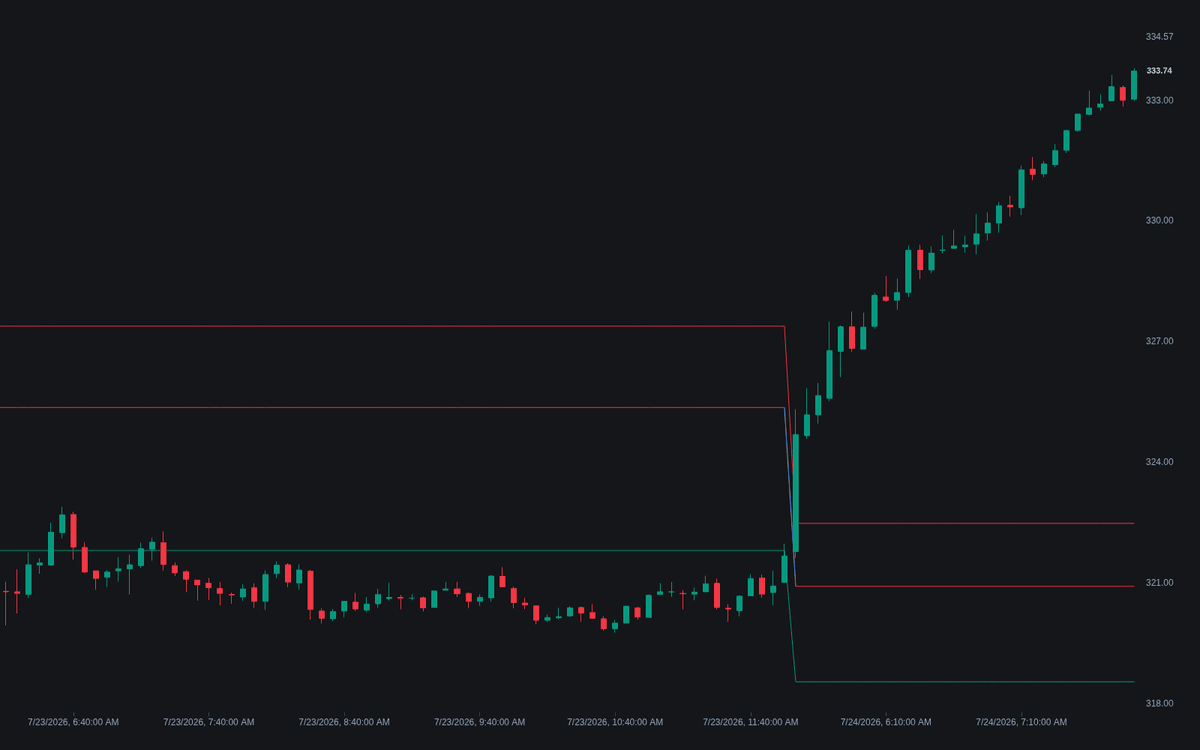
DeMark Pivots derives a reference pivot flanked by a single projected resistance and support for the coming session, weighting the prior session's inputs by how it closed against its open. The first faithful build of DeMark pivots in the Library renders PP, R1 and S1 as clean horizontal steps, with gradient shading between the pivot and each projected level visualizing the estimated range envelope.
How to Trade the DeMark Pivots?
- R1 / S1 as a range estimate: treat the projected levels as the session's estimated high and low — fade touches or frame breakouts through them, with alerts on every level cross.
- Tilt-colored pivot: the pivot takes the support color after an up session and the resistance color after a down one, exposing the directional read encoded in the weighting.
- Continuation open: when a new session opens past the pivot on its tilted side, dedicated bullish and bearish alerts flag continuation pressure.
Projecting a single level each way, this member of the levels family suits traders who prefer a clean pre-session reference to a dense ladder.
DeMark Pivots Settings
- Anchor period (default Auto): the session the levels are computed from; Auto picks Daily on intraday charts, Weekly on daily, Monthly on weekly and Yearly above. The anchor must sit above the chart timeframe.
- Use current session open (default disabled): compares the prior close against the current session open when selecting the weighting; keep it disabled for the common published form.
- Style toggles: Pivot (PP), Tilt-colored pivot, Projected range gradient and Level labels (all enabled) control the pivot's visibility, its tint, the range shading and the price labels.
Frequently Asked Questions
How are DeMark pivots different from floor pivots?
The classic floor pivots average the prior high, low and close identically every session and print a full ladder. The DeMark formulation first checks how the prior session closed against its open, weights that side's extreme more heavily, and outputs only PP, R1 and S1.
Why do the levels sometimes disappear?
Projection needs one completed anchor session, and the anchor must sit above the chart timeframe — a warning appears when it does not. Switching between regular and extended-hours data also changes the session inputs and therefore the levels.
Which anchor period should I use?
The Auto default projects levels from the next natural period above your chart, which is how the system is normally read. Fix Daily, Weekly or Monthly when you want, say, weekly levels on an hourly chart.

The Library is free. Quant makes it yours.
Pull any concept or indicator into Quant: rebuild it, retune it, or turn it into a backtested strategy of your own.