Floor Pivots
 By LuxAlgoApr 16, 2026
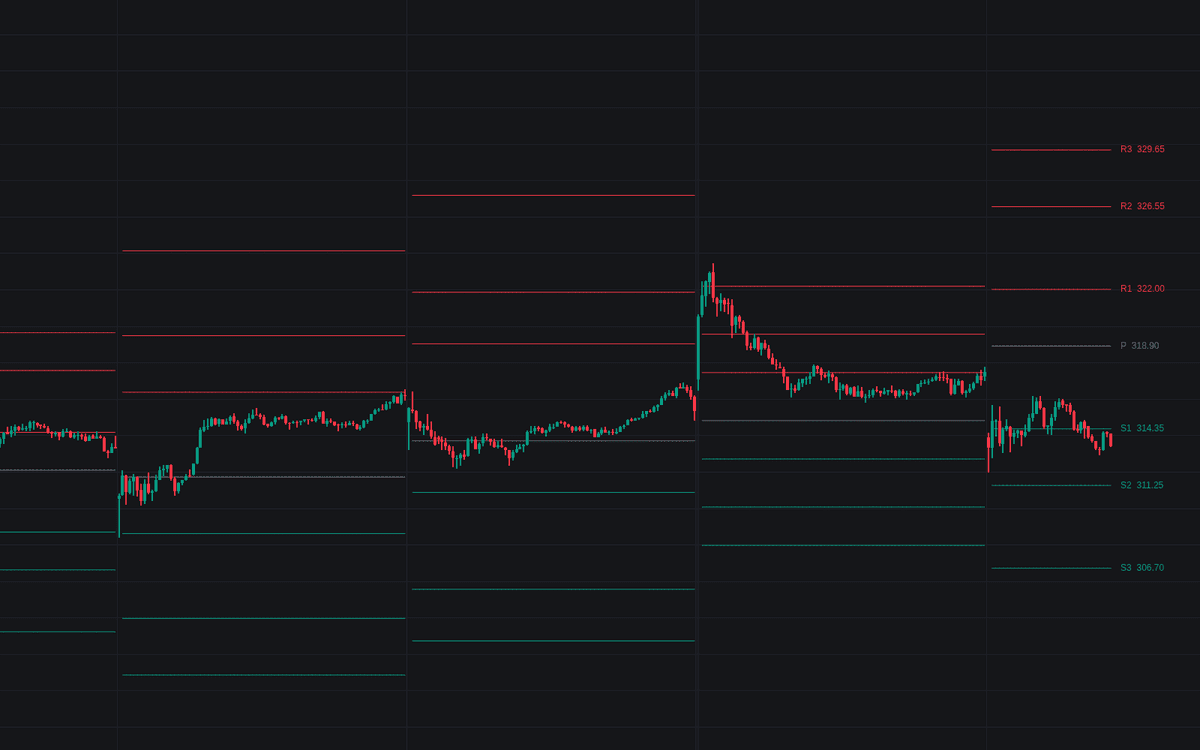

Floor Pivots is the definitive clean build of floor pivots, the classic pivot ladder handed down from exchange floors: P averages the prior period's high, low and close, R1 and S1 reflect the prior extremes through it, R2 and S2 sit a full prior range out, and R3 and S3 cap the ladder under a selectable formula. Every level computes once per period from finished data (nothing repaints intraperiod), and each set draws as its own flat segment, breaking cleanly at the roll.
How to Trade the Floor Pivots?
- Above P: bias leans long while the pivot holds as support; below P the lean flips. Both crosses fire alerts.
- R1 / S1: the first fade references in rotational trade. A one-sided push beyond either is the range trader's cue to quit fading.
- R2 / S2: the second tier, one full prior range from the pivot; closes above R2 or below S2 fire their own alerts.
- R3 / S3: the outermost rungs; closes walking the ladder tier by tier are the signature of a trend session.
Floor Pivots Settings
- Anchor Period (default Daily): which finished period's high, low and close feed the formulas, with Weekly, Monthly and Yearly serving higher-timeframe context. On 24-hour markets the feed's day boundary shifts every level.
- R3 / S3 Formula (default Classic): Classic computes R3 = H + 2 × (P − L) and S3 = L − 2 × (H − P); Range Multiple places both two full ranges from P. Lower tiers are identical under both.
- Pivot (P), R1 / S1, R2 / S2, R3 / S3 (all default on): per-tier visibility toggles.
- Level Labels (default on) and Line Width (default 1) handle the drawing itself.
Frequently Asked Questions

Original indicatorBuilt in-house by LuxAlgo
The Library is free. Quant makes it yours.
Pull any concept or indicator into Quant: rebuild it, retune it, or turn it into a backtested strategy of your own.