Distribution Day Count
 By LuxAlgoOct 9, 2026
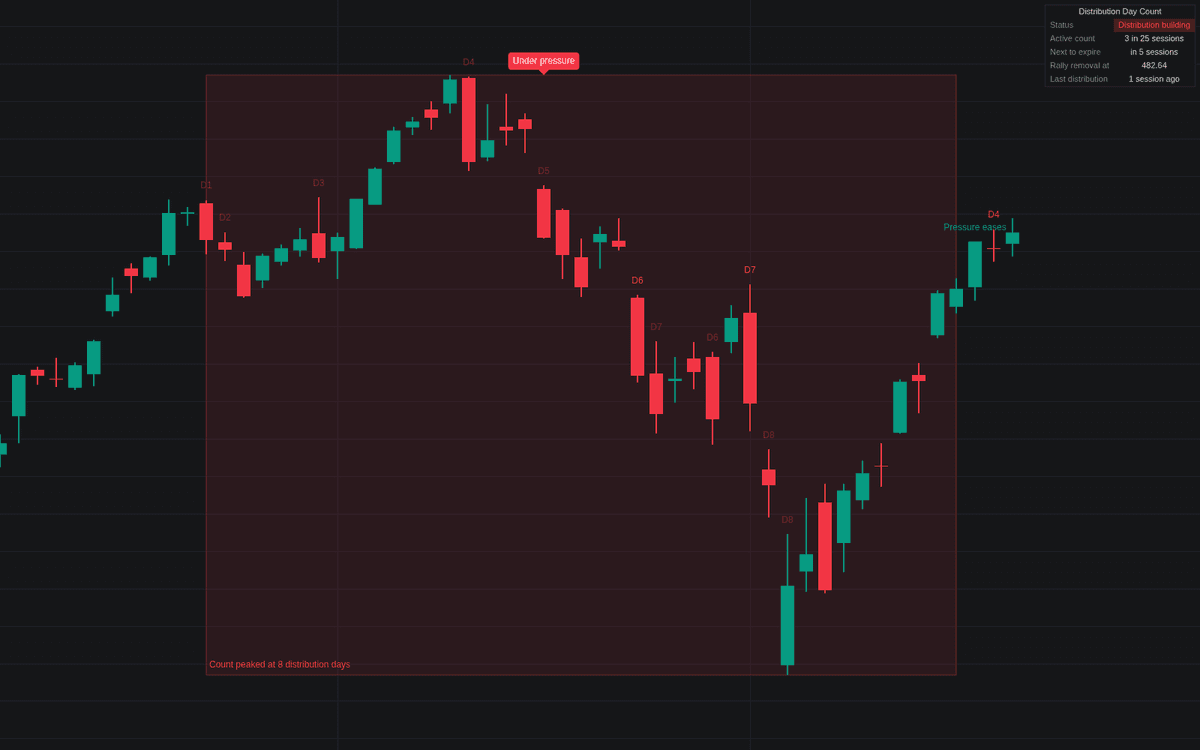

The Distribution Day Count is a sophisticated market analysis tool designed to track institutional selling pressure within broad market indices. By identifying sessions where major price declines occur on elevated trading volume, the indicator provides traders with a quantitative measure of market health. This tool helps identify when an uptrend is potentially weakening or when a market environment has become increasingly risky, allowing for better informed defensive positioning during periods of significant institutional selling.
How to Trade the Distribution Day Count?
The indicator is most effective when applied to major market indices or corresponding index ETFs using daily bars. The primary purpose of this tool is to monitor institutional activity rather than provide precise entry signals for individual stocks.
A distribution day is marked when the price closes down by a specific percentage on higher volume than the prior session. You should keep a close eye on the total count of these days within the specified lookback window. When the count remains low, the market is generally viewed as healthy. However, as the number of active distribution days climbs, the market enters a period of being "under pressure."
Practical trading application involves looking at the density of these days. If a cluster of distribution days occurs within a short period, it often signifies that institutional investors are offloading large positions, which frequently precedes a market correction or a significant pullback. Traders often use this information to tighten stop losses on existing positions, reduce leverage, or move into cash when the "Uptrend under pressure" status appears on the dashboard. Stalling days can also be included to identify periods where the market struggles to make new progress despite high volume, offering an additional layer of insight into market fatigue.
Distribution Day Count Settings
Distribution Rules
- Minimum Decline %: Sets the threshold for a price drop to be counted as a distribution day.
- Count Window: Defines the number of sessions a distribution day remains active before it expires.
- Rally Removal %: Determines the percentage gain required to remove a distribution day early, signaling that the market has absorbed the selling pressure.
- Rally Measured On: Choose whether to calculate the rally removal based on the closing price or the intraday high.
Stalling Days
- Count Stalling Days: Toggles the inclusion of days where the market shows heavy volume but makes little upward progress.
- Stalling: Maximum Gain %: The maximum upward close allowed for a day to still qualify as stalling.
- Stalling: Within % of High: Sets the proximity to the recent highs required for a day to be flagged as stalling.
Market Status
- Under Pressure At: Defines the number of active distribution days required to trigger the "Uptrend under pressure" warning.
Dashboard
- Show Dashboard: Toggles the on-screen data panel.
- Position: Sets the screen corner for the dashboard display.
- Size: Adjusts the scale of the dashboard text.
Style
- Keep Expired Markers: Allows visual markers for old distribution days to remain on the chart.
- Shade Pressure Clusters: Highlights the specific cluster of days that pushed the count into the "under pressure" status.
Frequently Asked Questions
Free on Vela
Run it on Vela. Go further with a paid plan.
- Up to 500 strategy alerts, with webhook automation
- Up to 10× the chart history of Free
- Orderflow lookback up to full history
- Up to 100,000 monthly credits for Quant to customize it
- Futures data alongside crypto, stocks, forex and commodities

Run it on Vela. Make it yours with Quant.
Open this indicator free on Vela, our next-generation charting platform. Then ask Quant, our coding agent built into Vela, to retune it or turn it into a backtested strategy of your own.