Distribution Days
Distribution Days, also known as distribution day, IBD distribution days, distribution day count, are Breadth, Sentiment & External Data concepts. The Library holds 1 implementation, a working definition you can pull into Quant.
Top Distribution Days indicator
The top custom implementation, built on the original standard Distribution Days formula.
1 total
The Distribution Days implementation below can become a backtested trading strategy — describe your rules and Quant writes the code.
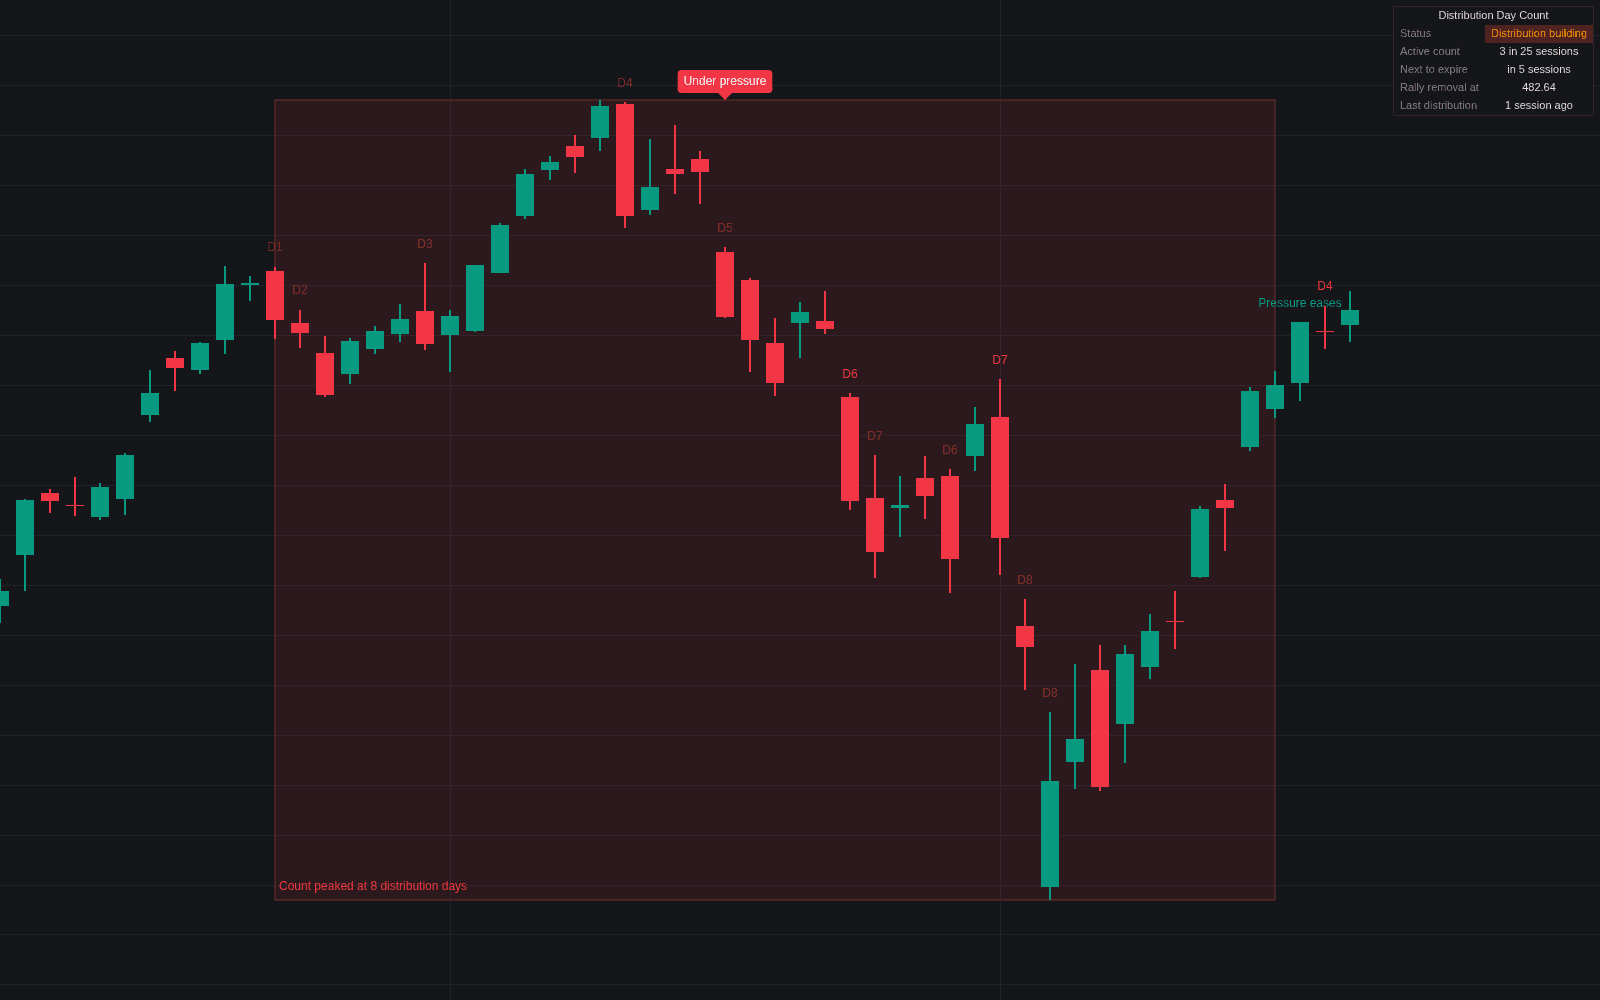
What are distribution days?
A distribution day is a session in which a major stock index closes down at least 0.2% on higher volume than the session before, and the count tallies them over a rolling 25-session window as a gauge of institutional selling in William O'Neil's market-direction method. It is a core test for the M, market direction, in the CAN SLIM approach of O'Neil's How to Make Money in Stocks (first published in 1988), and Investor's Business Daily applies it daily, counting the Nasdaq Composite and the S&P 500 separately. The 0.2% threshold is not rounded: a 0.19% loss does not qualify.
Single days mean little; the count is the signal. In IBD's practice a distribution day stays in the count for 25 sessions, and drops out earlier if the index rallies 5% above that day's close. O'Neil wrote that a cluster of roughly four or five distribution days over four or five weeks is usually enough to turn an advancing market down, and IBD's market outlook moves from confirmed uptrend to uptrend under pressure, then to market in correction, as the tally builds and leading stocks falter.
O'Neil also counted a subtler form, the stalling day: heavy volume with little or no upward progress after an advance, the index-level version of churn.
The logic is that large funds cannot exit in a day, so their selling shows up as a series of high-volume down sessions near highs. The weaknesses are plain too: the 0.2% bar is low enough for ordinary noise to qualify, volume swells on index rebalancing and options expiration days, counts depend on the volume series used, and independent tests are scarce. It is a risk dial rather than a sell signal, paired with its bullish counterpart, the follow-through day.
How it's calculated
A rolling count of high-volume down days on one index, with IBD's two expiry rules.
Some counters test the 5% removal against intraday highs rather than closes, and stalling days are added at the analyst's discretion, so published counts can differ.
How traders use it
- Exposure control: O'Neil-style traders slow new buying and tighten stops as the count rises, rather than selling everything at one threshold.
- Rally health after a bottom: distribution days stacking up within days of a follow-through are an early sign the new uptrend is failing.
- Index divergence: a count building on the Nasdaq but not the S&P 500 points to selling concentrated in growth and technology names.
- Breadth confirmation: a rising count alongside participation divergence or weakening up/down volume tells the same story from different data.
Distribution days vs related concepts
Follow-through Day: The bullish counterpart in O'Neil's rules: a strong up day on higher volume confirming a new uptrend after a correction. Distribution days accumulate to question an uptrend; a follow-through day is a single event marking a possible bottom.
Up/down Volume: Splits exchange volume between advancing and declining stocks across the market. A distribution day uses only the index's change and total volume against the prior day, a much coarser test.
Churn: Churn is heavy volume with little price progress on any chart. O'Neil's stalling day is churn at the index level after an advance; the classic distribution day requires an actual decline.
Concept family
Breadth, Sentiment & External Data
56 concepts mapped · 56 in the Library
Distribution Days FAQ
Turn Distribution Days into a trading strategy.
Take the implementation from this page into Quant, then build on it, backtest it on real data, and keep refining it in conversation.