Donchian Channels
 By LuxAlgoApr 13, 2020
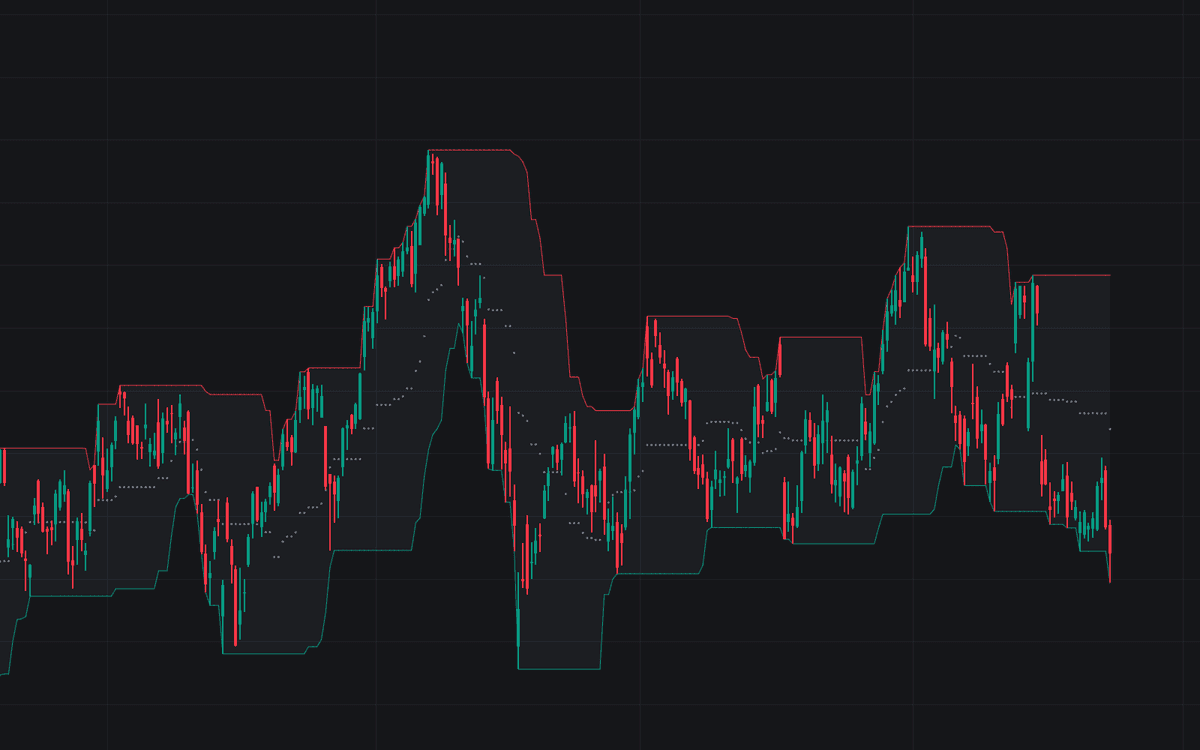

Donchian Channels plot the highest high and lowest low of the last 20 bars as upper and lower bands, with a midline halfway between them, the construction often called a Price Channel. The bands mark the exact levels where price prints a fresh 20-bar extreme, referenced by breakout approaches since Richard Donchian's early trend-following work: a push through the upper band is, by definition, a new high.
This is the raw standard calculation with the classic length of 20. The Upper and Lower bands draw as lines with a subtle fill between them; the Middle line (the average of the two) plots as circles.
How to Trade the Donchian Channels?
- Close above the prior bar's upper band: a new 20-bar high, the classic long breakout; the build fires its Breakout Up alert on this cross.
- Close below the prior bar's lower band: a new 20-bar low, covered by the Breakout Down alert.
- Bands ratcheting one way while price rides that band: the footprint of a persistent trend; the far band doubles as a trailing exit.
- Both bands flat: no new extremes on either side, a range with objectively marked boundaries.
- The Middle line: a pullback reference in trends, a fade target inside flat channels.
The current bar's high and low are part of the window, so price can never poke outside its own channel intrabar. Breakouts are judged against the previous bar's bands, exactly how the alerts are evaluated.
Donchian Channels Settings
- Length (default 20): the lookback for the highest high and lowest low. Longer demands rarer extremes: fewer, later breakouts and a wider channel; shorter reacts sooner and whipsaws more in congestion. The Upper, Middle, Lower, and Fill inputs only control colors.
Frequently Asked Questions

The Library is free. Quant makes it yours.
Pull any concept or indicator into Quant: rebuild it, retune it, or turn it into a backtested strategy of your own.