Concept
Donchian Channels
Donchian Channels are Volatility concepts. The Library holds 3 implementations, each one a working definition you can pull into Quant.
Top Donchian Channels indicators
The top custom implementations, built on the original standard Donchian Channels formula.
3 total
From studying Donchian Channels to trading it: take any implementation below into Quant and backtest it instantly.
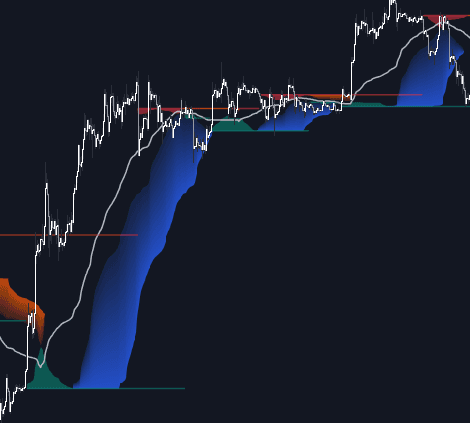
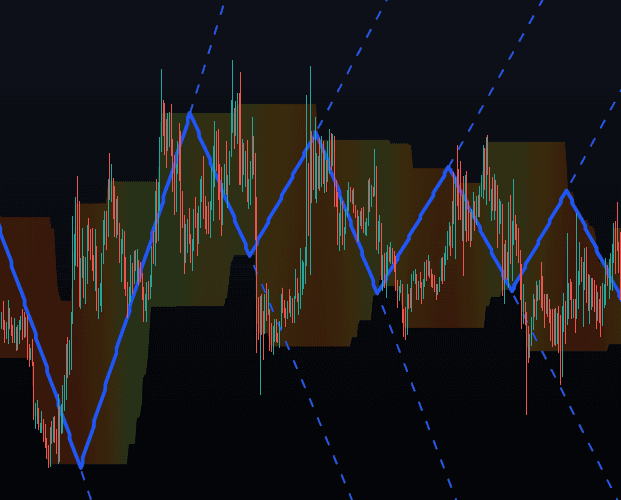
The standard Donchian Channels indicator
Donchian Channels exactly as classically defined: the faithful reference build of the original formula, free to run in Quant.
What are Donchian Channels?
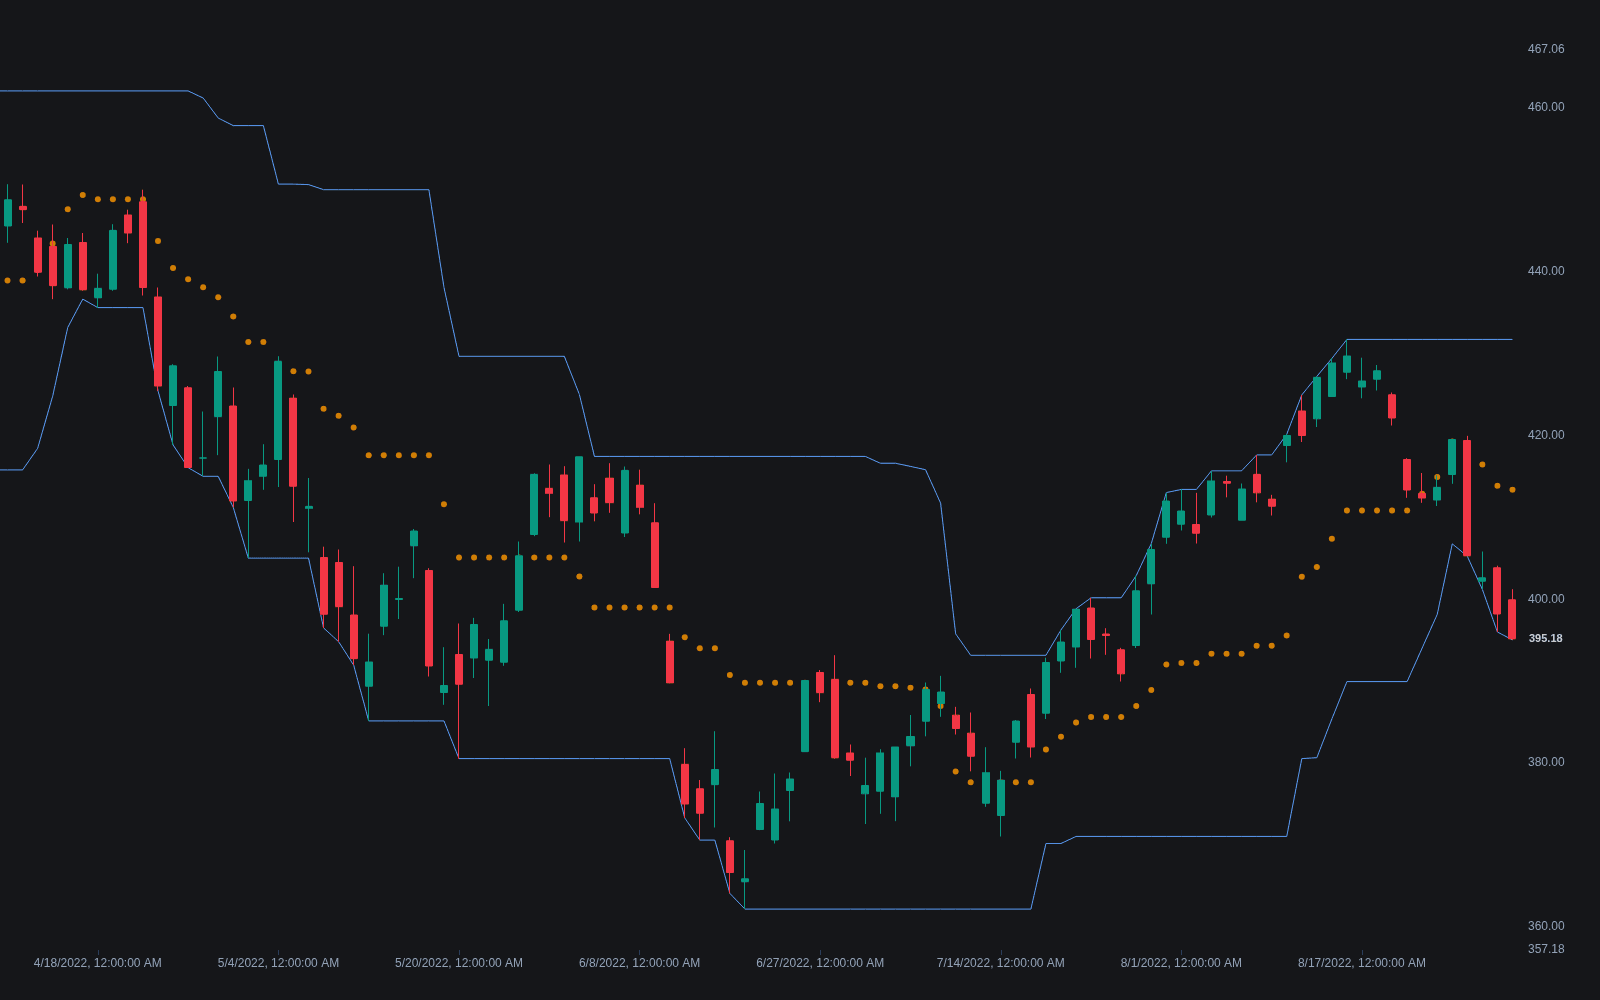
Donchian Channels plot the highest high and lowest low of the last N bars, usually with a midline halfway between them. They are named for Richard Donchian, a founding figure of systematic trend following whose four-week rule bought new four-week highs and sold new four-week lows. The channel contains no averaging and no volatility math: the upper band is simply the level a bar must exceed to print a new N-period high, which makes it the natural chart object for breakout logic, since touching the band and making a new extreme are the same event.
The bands move in a staircase: the upper band rises only when a new N-period high prints, drops only when the standing high ages out of the window, and holds flat otherwise. Price hugging one band while the bands step in the trend's direction is the visual signature of persistence, and the distance between the bands (Donchian Width) doubles as a simple volatility measure. The breakout reading is best known from the Turtle traders, whose published entry and exit rules were built on Donchian-style N-day extremes.
How to calculate Donchian Channels
Construction needs nothing but highs and lows; the only decisions are the lookback and whether the current bar counts.
- 1Choose the lookback N: 20 bars is the classic choice, with 55 common for slower systems and 10 for exits.
- 2Set the upper band to the highest high of the last N bars and the lower band to the lowest low of the last N bars.
- 3Set the midline to the average of the upper and lower bands.
- 4Decide whether the current bar is included: excluding it (using the prior N bars) means a push through the band is exactly a fresh N-bar extreme, which is how breakout systems typically define the trigger.
How it's calculated
The highest high and lowest low of the last n bars, with a midline halfway between.
Richard Donchian's four-week rule corresponds to n = 20 trading days; the Turtle systems entered on 20-bar and 55-bar channel breakouts.
Some implementations run the window over i = t - n to t - 1, excluding the current bar, so a new extreme registers as a breakout of the prior channel.
How traders use it
- As breakout entries: buying a push above the N-bar high and selling below the N-bar low is among the oldest systematic trend-following templates, popularized by Donchian's four-week rule and the Turtles' 20-day and 55-day systems.
- As trailing exits: trend positions trail the opposite band or the midline, exiting a long when price prints a new N-bar low on a shorter window than the entry (the Turtles paired 20-day entries with 10-day exits).
- As a trend read: stair-stepping bands with price pinned to one side indicate persistence, the basis of Donchian trend rules; flat bands on both sides frame a trading range with its extremes marked.
- As objective range markers: the bands are exact N-period extremes, so they anchor level-based logic (stops beyond the opposite band, range measurement, screening for new highs) without any smoothing ambiguity.
Donchian Channels vs related concepts
Bollinger Bands: Centered on a moving average and scaled by standard deviation, they describe typical dispersion around the mean. Donchian bands mark absolute extremes, which is why price can ride a Donchian band exactly while only approaching a Bollinger band.
Keltner Channels: An ATR offset around an EMA: a smoothed container for normal range. Donchian Channels carry no smoothing at all, so they respond instantly to new extremes and stay perfectly flat otherwise.
Prior Period Levels: Prior day, week, or month highs and lows are fixed once the period closes. A Donchian band is a rolling extreme that updates bar by bar as its window slides forward.
Concept family
Volatility
57 concepts mapped · 57 in the Library
Donchian Channels FAQ
Turn Donchian Channels into a trading strategy.
Take any implementation from this page into Quant, then build on it, backtest it on real data, and keep refining it in conversation.