EQH/EQL FVG Breakouts
 By LuxAlgoAug 17, 2026
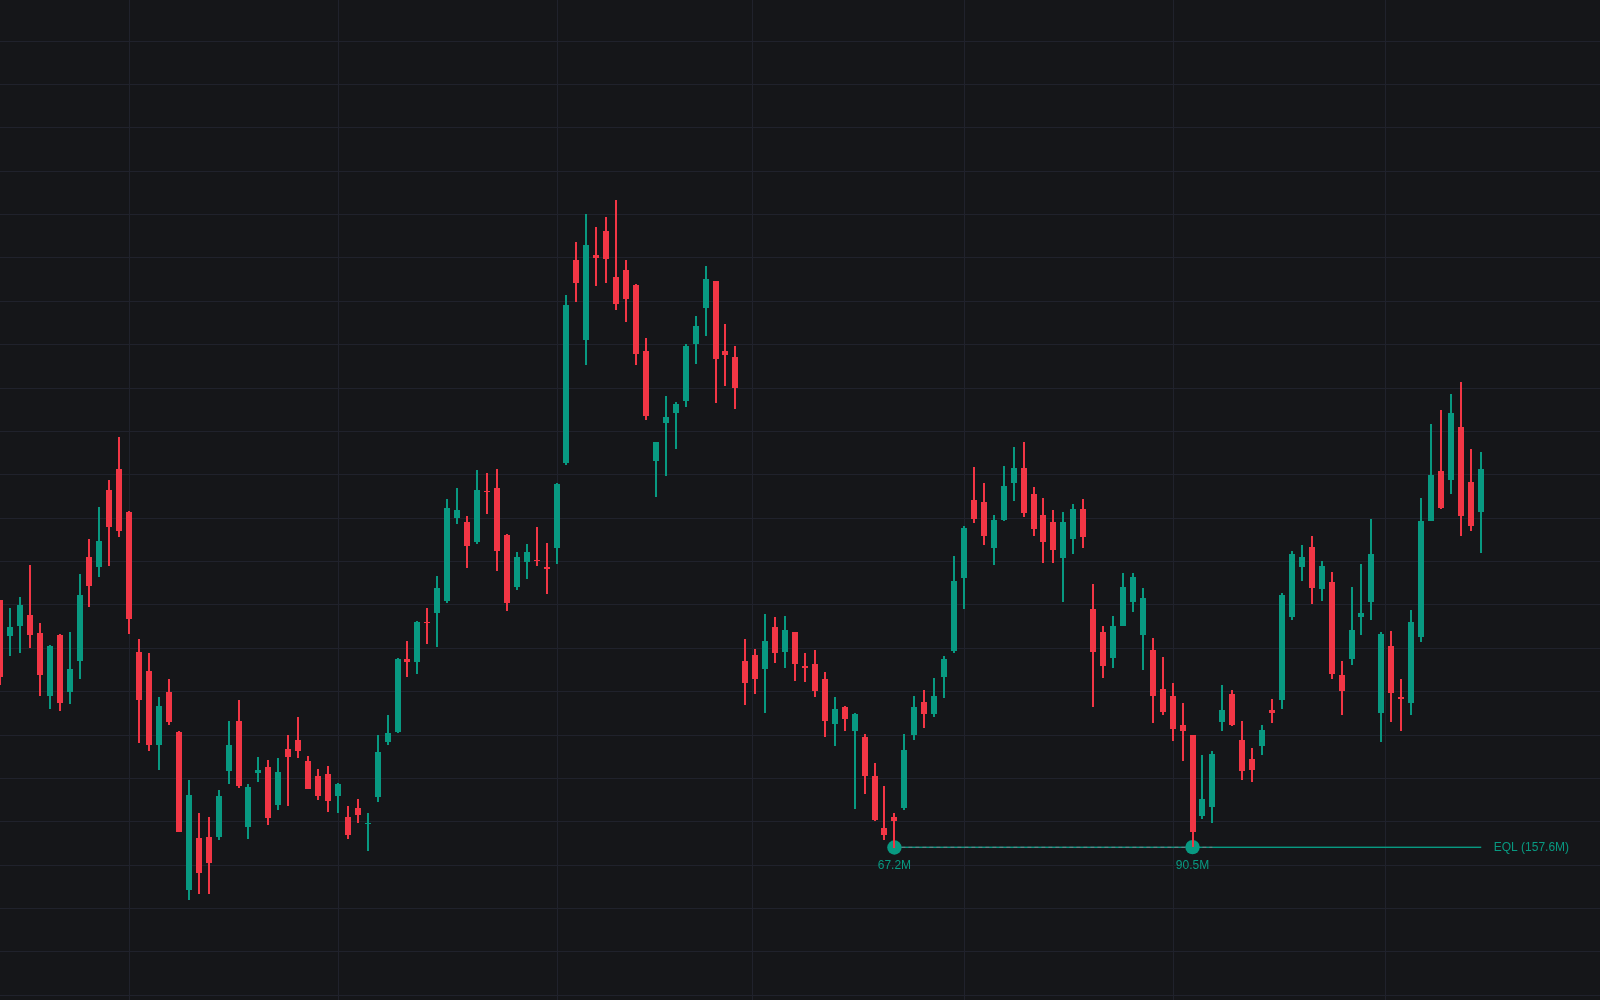

EQH/EQL identifies critical areas of liquidity by detecting equal highs and equal lows on the price chart. These patterns represent regions where market participants frequently cluster their stop loss orders, making them high interest zones for institutional activity and potential price reversals or significant breakout opportunities. By automatically visualizing these liquidity zones and tracking their accumulated volume and age, this indicator provides a clearer perspective on market structure and helps traders anticipate liquidity sweeps or confirm momentum breakouts.
How to Trade the EQH/EQL?
The core utility of this indicator lies in identifying areas where market participants are likely to be trapped or where stop orders are resting. You can use these zones in two primary ways: as support/resistance levels for mean reversion or as confirmation zones for breakouts.
When price approaches an identified EQH (Equal High) or EQL (Equal Low) zone, observe the reaction at that level. A sweep of the liquidity occurs when the price temporarily pushes past the level before reversing, often targeting the stop orders resting just beyond the zone. If the price fails to hold the level after a sweep, it often leads to a strong move in the opposite direction.
Conversely, for breakout trading, look for instances where the price pushes through the zone with strong momentum. The indicator facilitates this by highlighting breakout signals accompanied by a Fair Value Gap (FVG). A breakout that leaves behind a gap indicates a strong imbalance in buying or selling pressure, increasing the probability of a sustained move. Traders often look for these specific signals to enter in the direction of the breakout once the FVG is confirmed by the price action on the following candle.
EQH/EQL Settings
Liquidity Detection
- Pivot Left Length: Defines the number of bars required to the left to confirm a pivot high or low.
- Pivot Right Length: Defines the number of bars required to the right to confirm a pivot high or low.
- Equality Threshold (%): Sets the maximum percentage difference allowed between two highs or lows to classify them as equal.
- Max Active Zones: Limits the total number of unswept zones displayed on the chart.
- Max EQH/EQL Distance (Bars): The maximum number of bars allowed between the two pivots that form an EQH or EQL.
- Max EQH/EQL Age (Bars): The time limit for an unswept zone to remain active before it is removed.
Visuals
- Bullish/Bearish Zone Color: Sets the color used to distinguish between equal low (bullish) and equal high (bearish) zones.
- Zone Transparency: Adjusts the opacity of the liquidity zone boxes.
- Show Midline: Toggles a dashed line through the center of the liquidity zones.
- Show Volume: Displays the total volume associated with the pivot points forming the zone.
- Delete on Sweep: If enabled, the zone will be removed immediately once price crosses the sweep level.
Breakout Signals
- Show Breakout Signals: Toggles the triangle icons and labels that mark a strong breakout with a confirmed FVG.
- Breakout ATR Length: The period used for the Average True Range calculation to determine breakout strength.
- Min Breakout Body (ATR): The minimum candle body size relative to the ATR required to trigger a breakout signal.
- Show Breakout FVGs: Toggles the display of Fair Value Gaps associated with valid breakout signals.
- Min FVG Size (ATR): The minimum size required for a gap to be considered a valid FVG.
Frequently Asked Questions
Free on Vela
Run it on Vela. Go further with a paid plan.
- Up to 500 strategy alerts, with webhook automation
- Up to 10× the chart history of Free
- Orderflow lookback up to full history
- Up to 100,000 monthly credits for Quant to customize it
- Futures data alongside crypto, stocks, forex and commodities
Also on other platforms
Get free access to this indicator elsewhere.

The Library is free. Quant makes it yours.
Pull any concept or indicator into Quant: rebuild it, retune it, or turn it into a backtested strategy of your own.