Concept
Liquidity Pool
Liquidity Pool is a Smart Money Concepts / ICT concept. The Library holds 12 implementations, each one a working definition you can pull into Quant.
Top Liquidity Pool indicators
The top custom implementations, built on the original standard Liquidity Pool formula.
12 total
From studying Liquidity Pool to trading it: take any implementation below into Quant and backtest it instantly.
.png&w=3840&q=75)
.png&w=3840&q=75)
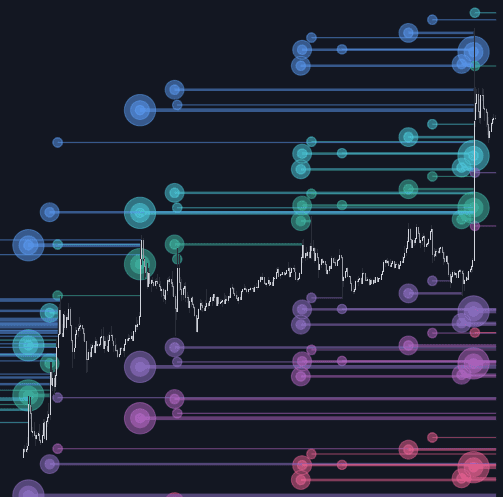
What is a Liquidity Pool?
A liquidity pool is a price region where resting orders are assumed to cluster: stop-losses and pending breakout entries stacked just beyond an obvious reference point. Swing highs and lows, equal highs and lows, prior session extremes, round numbers: any level enough traders lean against accumulates stops behind it. Smart Money Concepts / ICT vocabulary splits the map in two: pools above highs are buy-side liquidity (buy stops from shorts, plus breakout buys), and pools below lows are sell-side liquidity (sell stops from longs, plus breakdown sells).
The mechanism is counterparty demand. Size cannot enter or exit a market without opposing orders, and a triggered stop is exactly that: a market order firing at a known location. A dense pool is therefore a source of fills, which is why the framework treats untouched pools as magnets price gets drawn toward (the draw on liquidity). One caveat is structural: stop orders aren't visible on a price chart, so every pool is an inference from where traders plausibly positioned, never an observation.
The concept matters because it inverts classical support and resistance. Where the classical reading expects an obvious level to hold on approach, the liquidity reading expects it to be run first (a liquidity sweep collecting the stops behind it) before direction resolves. That one reframe gives failed breakouts a function, explains stop runs through obvious levels, and turns every untouched extreme on the chart into a candidate target.
How to identify a liquidity pool on a chart
Pools are inferred, not displayed; the workflow is to mark the levels traders visibly lean on and rank the stops likely resting behind them.
- 1Mark the obvious extremes: recent swing highs and lows, equal highs/lows, prior day/week/session extremes, and well-tested trendlines. Visibility is the whole game: the more traders can see a level, the more stops are likely to accumulate behind it.
- 2Rank the pools by expected size. Equal or multi-touch levels outrank single swings, higher-timeframe extremes outrank intraday ones, and levels that coincide with round numbers carry extra weight.
- 3Separate untouched pools from spent ones. A level that has already been traded through has largely surrendered its stops; the untapped pools on either side of price are the live candidates for a draw.
- 4Watch the behavior at contact. A fast rejection that closes back inside the range reads as a sweep of the pool; acceptance and continuation beyond it reads as a genuine breakout with initiative interest behind it.
How traders use it
- As targets: bearish ideas commonly aim at untapped sell-side below old lows and bullish ideas at buy-side above old highs, with exits set just in front of the pool so the target doesn't depend on the level breaking.
- As a reversal filter: instead of trading a level's first touch, many models wait for the pool to be run and rejected (a sweep followed by a shift in structure such as a change of character) before entering the other way.
- As a stop-placement audit: a stop parked just behind the most obvious level sits inside the pool most likely to be collected; placing it beyond the full pool, or sizing for the run, are the usual mitigations (stop placement vs liquidity pools).
- As a bias frame: once one side's pool is taken, attention rotates to the untouched pool on the other side; internal vs external range liquidity formalizes this alternation between objectives inside the range and beyond it.
Liquidity pool vs related concepts
Liquidity sweep: The pool is the location; the sweep is the event. A pool sits untouched until price runs through it and triggers the resting orders. That run, especially when price closes back inside the prior range, is the sweep.
Equal highs/lows as liquidity: Equal highs or lows are one specific, high-salience pool: two or more extremes at nearly the same price stack stops at the same spot, which is why they're treated as prime sweep candidates rather than strong walls.
S/R zone: Same locations, opposite default expectation. Classical support/resistance expects the obvious level to hold on approach; the liquidity lens expects it to be run for stops first. Which reading wins on a given touch is only clear from the reaction.
Resting liquidity / liquidity heatmap: Heatmaps plot visible resting limit orders from exchange order-book data. A liquidity pool is an inference about invisible stop orders. The two often mark similar levels, but one is measured and the other is deduced from structure.
More Liquidity Pool implementations
Concept family
Smart Money Concepts / ICT
54 concepts mapped · 54 in the Library
Liquidity Pool FAQ
Turn Liquidity Pool into a trading strategy.
Take any implementation from this page into Quant, then build on it, backtest it on real data, and keep refining it in conversation.