Concept
Trading Range
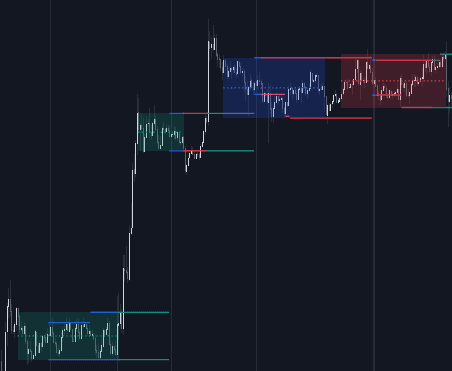
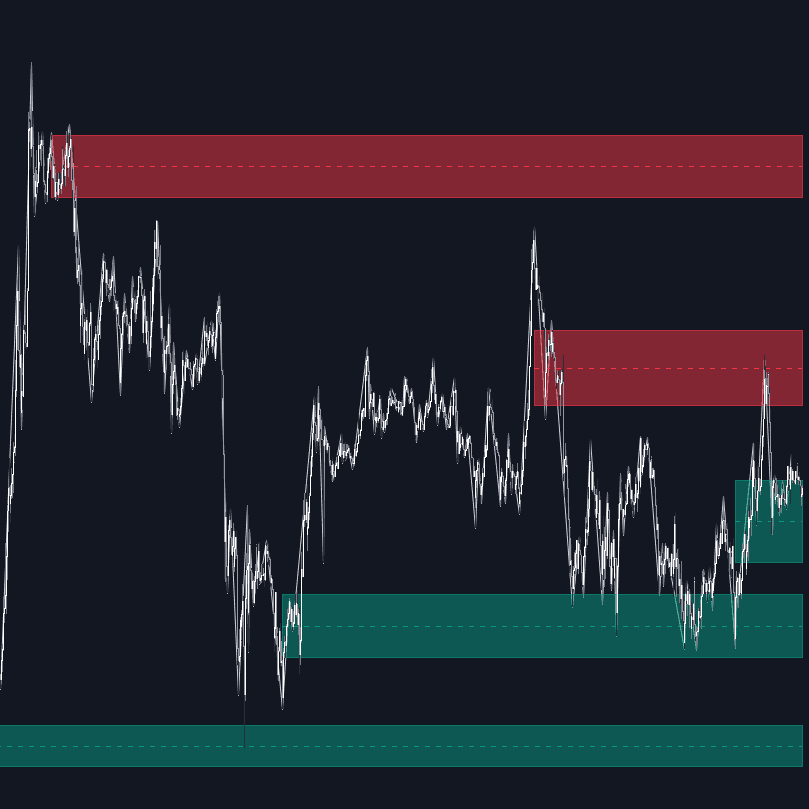
Trading Range, also known as range high/low, equilibrium, midpoint reversion, is a Market Structure concept. The Library holds 8 implementations, each one a working definition you can pull into Quant.
Top Trading Range indicators
The top custom implementations, built on the original standard Trading Range formula.
8 total
Every Trading Range implementation here is strategy-ready: open one in Quant, set your rules, and it backtests automatically.
.png&w=3840&q=75)
What is a Trading Range?
A trading range is a sideways stretch of price contained between a defined high and a defined low: repeated tests of a ceiling that sells and a floor that buys, with neither side able to force a lasting escape. In auction terms the market is in balance, rotating around a price both buyers and sellers currently accept. The range high, the range low, and the midpoint (often called equilibrium) become well-defined support and resistance references for as long as the balance lasts.
Behavior inside the box has a recognizable texture. The edges reject while the middle churns, participation often fades during rotations and expands at the boundaries, and attempted escapes frequently fail, which is why the false breakout is treated as a native feature of ranges rather than an anomaly. Wyckoff read ranges as the footprint of campaigns, accumulation or distribution, while Smart Money Concepts traders split the same box into premium and discount halves around equilibrium.
Ranges matter because markets spend much of their time in balance, and the range playbook inverts the trend playbook: fading the edges can keep working until the one breakout that ends the range, while trend entries taken inside the box tend to whipsaw. Classifying the regime correctly is often worth more than any individual signal, and a completed range's extremes remain reference levels long after price leaves. None of this is guaranteed; ranges end without notice.
How to identify a trading range
A range is defined by rejection at both extremes, so identification comes down to finding those extremes and confirming the sideways character between them.
- 1Locate at least two swing highs stopping in one horizontal zone and two swing lows stopping in another. Touches rarely land to the tick, so treat both boundaries as zones rather than exact lines.
- 2Mark the range high, the range low, and the midpoint at 50% of the height. A usable range should be wide enough on your timeframe to trade after spreads and costs.
- 3Confirm the sideways character: heavily overlapping candles, alternating failures at both edges, flattening moving averages, and low trend-strength readings all point the same way.
- 4Track how price leaves the extremes. A quick rejection back inside keeps the range alive; closes beyond an edge, followed by a retest that holds outside, mark acceptance and a likely transition to trend.
How it's calculated
A horizontal zone bounded by a confirmed high and low that price rotates inside until a breakout ends it.
Detection details vary; pivot-based tools set RH and RL from swing highs and lows instead of a window extreme, and some use volatility compression alone.
Midpoint reversion describes trades that fade RH or RL back toward Mid while the range holds.
There is no single published parameterization, so n, k, and p are implementation choices.
How traders use it
- Edge fading: selling tests of the range high and buying tests of the range low, targeting the midpoint or the opposite edge, with invalidation on acceptance beyond the boundary. This mean-reversion approach can win repeatedly inside the box but loses on the eventual break, so stop discipline carries the strategy.
- Breakout trading: waiting for the range to resolve, then trading the escape or its pullback, often projecting the range height beyond the broken edge as an initial objective under the classical measure rule.
- Liquidity framing: stops accumulate beyond range extremes and equal highs or lows, so a liquidity sweep through the boundary that fails to hold outside is read by many traders as evidence the range will rotate back toward the other side.
- Regime filtering: trend/range classifiers gate systems on and off, disabling trend entries while a range is detected and enabling reversion logic, on the reasoning that getting the regime call right matters more than tuning either strategy in isolation.
Trading Range vs related concepts
Rectangle: The rectangle is the classical chart-pattern name for the same sideways box, usually catalogued as a continuation pattern with a measured objective. "Trading range" is the broader regime term and builds in no assumption about which way it resolves.
Value Area: The value area is derived from volume (commonly the region holding about 70% of a profile's volume), while a trading range is drawn from price extremes. In a balanced market they often overlap, but they are constructed from different data.
Accumulation vs Distribution Ranges: Wyckoff's sub-classification of what a range means: quiet absorption before markup, or quiet unloading before markdown. The trading range is the container; accumulation and distribution are competing hypotheses about what is happening inside it.
Opening Range & ORB: The opening range is bounded by time, the first minutes of a session, so it exists every day whether or not price is balanced. A trading range is bounded by structure: repeated rejection at both extremes, however long that takes.
More Trading Range implementations
Concept family
Market Structure
31 concepts mapped · 31 in the Library
Trading Range FAQ
Turn Trading Range into a trading strategy.
Take any implementation from this page into Quant, then build on it, backtest it on real data, and keep refining it in conversation.